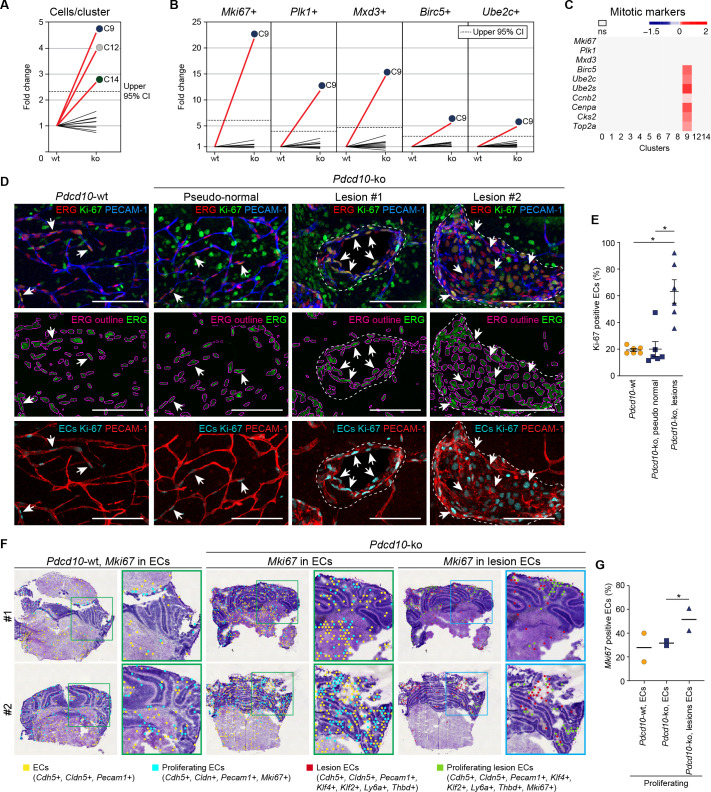
Figure 4. Pdcd10-ko cells of C9 express the same top mitotic phenotype as overt cavernomas.
(A) Plot of fold-change in numbers of Pdcd10-ko versus Pdcd10-wt cells in each cluster. (B) Plots of fold-change in the percentages (Pdcd10-ko vs. Pdcd10-wt) of cells positive for Mki67, Plk1, Mxd3, Birc5, and Ube2c in each cluster (as indicated). Dashed lines in (A) and (B) show upper limit of 95% confidence interval (CI), calculated from the mean fold-changes among the clusters. Red lines, clusters with fold-change >95% CI upper limit. (C) Heatmap of average logFC (padj <0.05) in the Pdcd10-ko vs. Pdcd10-wt for selected mitotic markers (as indicated). (D) Representative confocal microscopy of Pdcd10-wt and Pdcd10-ko mouse cerebellum at P8. Upper panels: Immunostained for PECAM-1 (pan-endothelial, blue), ERG (pan-endothelial nuclei, red) and Ki-67 (encoded by Mki67 transcript; mitotic nuclei, green). Central panels: Immunostained for ERG (green) with outlines of the segmented nuclei (magenta). Lower panels: Results of the filtering procedure showing EC-specific immunostaining of Ki-67 (ECs Ki-67, light blue) and PECAM-1 (red) (see Materials and methods). Arrows, mitotic ECs. Scale bars: 100 μm. (E) Quantification of mitotic ECs in the cerebellum, as normal vessels in Pdcd10-wt, Pdcd10-ko pseudo-normal vessels, and Pdcd10-ko lesions (mean ± SEM; *p<0.01; ANOVA followed by Tukey’s multiple comparisons). Pdcd10-wt, n = 6; Pdcd10-ko, n = 6. (F) Visium analysis showing spots positive for ECs (yellow) and lesion EC markers (red), identified as indicated, with co-expression of Mki67. Proliferating ECs (light blue) and proliferating lesion ECs (green) containing spots are shown. Higher magnifications of boxed areas are also shown. (G) Quantification of the percentages (%) of proliferating ECs (light blue) and proliferating lesion ECs (green) containing spots as in (F) (Mean; *p<0.01 Fisher’s exact test).


