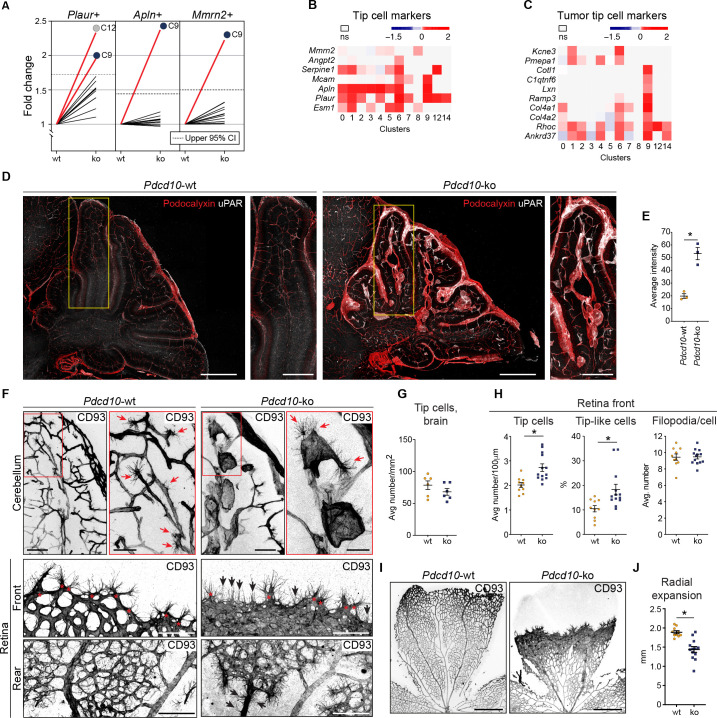
Figure 5. Pdcd10-ko cells widely enhance the tip cell phenotype with greatest expression for cluster C9.
However, such tip cell phenotype is functionally defective. (A) Plots of the fold-changes in the proportions (Pdcd10-ko vs. Pdcd10-wt) of cells positive for Plaur, Apln, and Mmrn2 in each cluster. Dashed line shows upper limit of 95% confidence interval (CI), calculated on the mean fold-change among the clusters. Red lines highlight clusters with fold-changes > 95% CI upper limit. (B) Heatmap of average logFC (padj <0.05) for Pdcd10-ko vs. Pdcd10-wt for selected tip cell markers (as indicated). (C) Heatmap of average logFC (padj <0.05) for Pdcd10-ko vs. Pdcd10-wt for selected tumor tip cell markers (as indicated). (D) Representative confocal microscopy of Pdcd10-wt and Pdcd10-ko mouse cerebellum at P8, immunostained for Podocalyxin (pan-endothelial, red) and uPAR (tip cell marker, encoded by Plaur, white). Scale bars: main, 500 μm; magnifications, 250 μm. (E) Quantification of uPAR staining as in (D) (mean ± SEM; *p<0.01; unpaired t-test). Pdcd10-wt, n = 3; Pdcd10-ko, n = 3. (F) Representative confocal microscopy of Pdcd10-wt and Pdcd10-ko mouse cerebellum (top) and retina (bottom) at P8, immunostained for CD93 (pan-ECs membrane and filopodia, at P8). Retina vessels are shown for the migrating front (Front) and proximal to the optic nerve (Rear). Red arrows and asterisks (in magnifications), tip cells (filopodia-rich cells); black arrows, tip-like cells at the migrating front in the Pdcd10-ko retina. Tip-like cells were present in the vein proximal to the optic nerve (Rear, black arrows) exclusively for the Pdcd10-ko. Scale bars: main, 100 μm. magnifications, 50 μm. (G) Quantification of tip cells in the cerebellum (mean ± SEM; ns; unpaired t-test). Pdcd10-wt, n = 6; Pdcd10-ko, n = 6. (H) Quantification of tip cells and tip-like cells at the retina front, for tip cell density (mean number/100 μm; left), proportion of tip-like cells (%; middle), and number of filopodia/cell (mean ± SEM; right; *p<0.01; unpaired t-test with Welch’s correction or Mann-Whitney for tip-like cells). Pdcd10-wt, n = 10; Pdcd10-ko, n = 13. (I) Representative lower magnification images of whole-mount retina preparations immunostained for CD93. Scale bars: 500 μm. (J) Quantification of radial expansion (mm; mean ± SEM; *p<0.01; unpaired t-test). Pdcd10-wt, n = 10; Pdcd10-ko, n = 13.


