. 2020 Nov 3;9:e61413. doi: 10.7554/eLife.61413

Figure 6. STREAM trajectory analysis shows Pdcd10-ko venous cluster 9 concentrated in a distinctive branch with mitotic and abnormal tip cell functions.

(A) Flat tree view of the STREAM trajectory inferred for Pdcd10-wt and Pdcd10-ko cells of the most affected clusters (C1, C6, C7, C8), color coded as indicated. Branching and end points are numbered sequentially (S0, S1, S2, S3, S4, S5) and each branch is named after the points connected (S0–S1, S0–S2, S4–S3, S3–S0, S5–S3). For corresponding three-dimensional views of the STREAM trajectories see Figure 6—figure supplement 1A and B. (B) Flat tree view of the trajectory as in (A) showing separately Pdcd10-wt (orange) and Pdcd10-ko (blue) cells. Red and black arrows, Pdcd10-ko specific branches (S0–S2, S3–S0, respectively). Light-blue arrows, Pdcd10-ko cells showing altered distributions within the other branches. (C) Distributions of Pdcd10-wt (orange) and Pdcd10- ko (blue) cells according to cluster, for the five branches of the trajectory. Pdcd10-ko cells of Cluster 9 (top row, blue peaks) show the most heterogeneous distributions with the cells in branches S0–S1, S0–S2, and S3–S0. (D) Flat tree view showing expression levels in Pdcd10-wt (left) and Pdcd10-ko (right) cells for three representative lesion markers: Klf4, Ly6a, and Thbd. (E) Plots showing the percentage of cells positive for the progenitor cell markers Bst1, Peg3, Procr, and Cd200 (as indicated) for Pdcd10-wt (orange) and Pdcd10-ko (blue) in each branch of the trajectories in (A) and (B). See Materials and Methods for definition of positive cells. (F) Plots showing numbers of cells double positive for Mki67 and for indicated progenitor cell markers for Pdcd10-wt (orange) and Pdcd10-ko (blue) in each branch of the trajectories in (A) and (B). See Materials and methods for definition of positive cells. (G) Flat tree view showing expression levels of Klf4 for Pdcd10-wt (left) and Pdcd10-ko (right), for each of the progenitor cell subpopulations investigated. In (D and G) dots are color coded for expression levels, as blue, low; red, high.

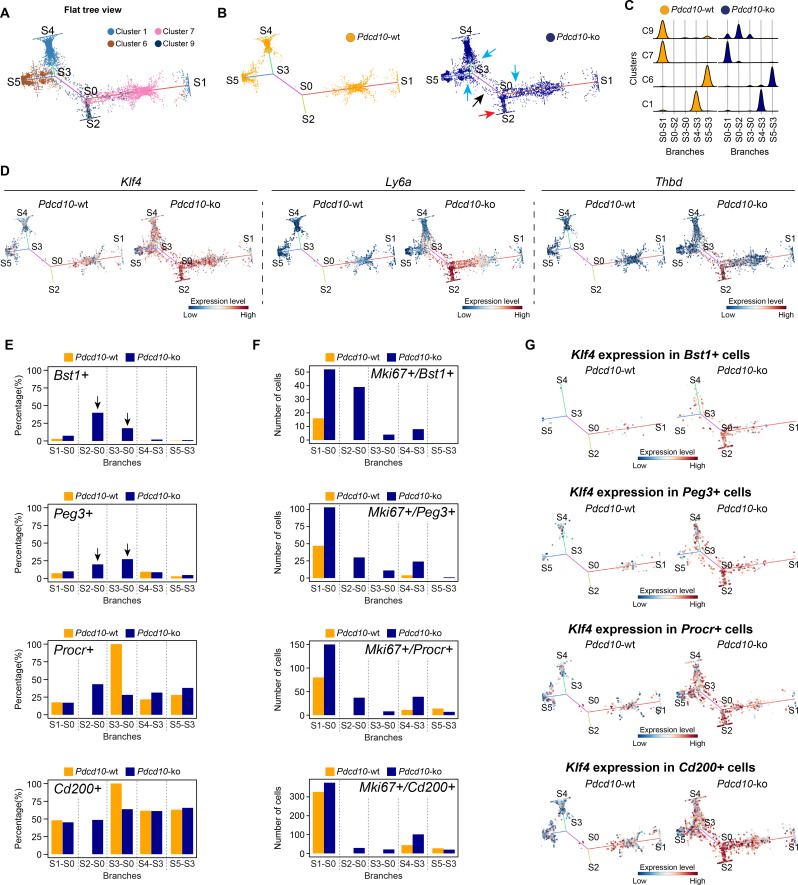
Figure 6.

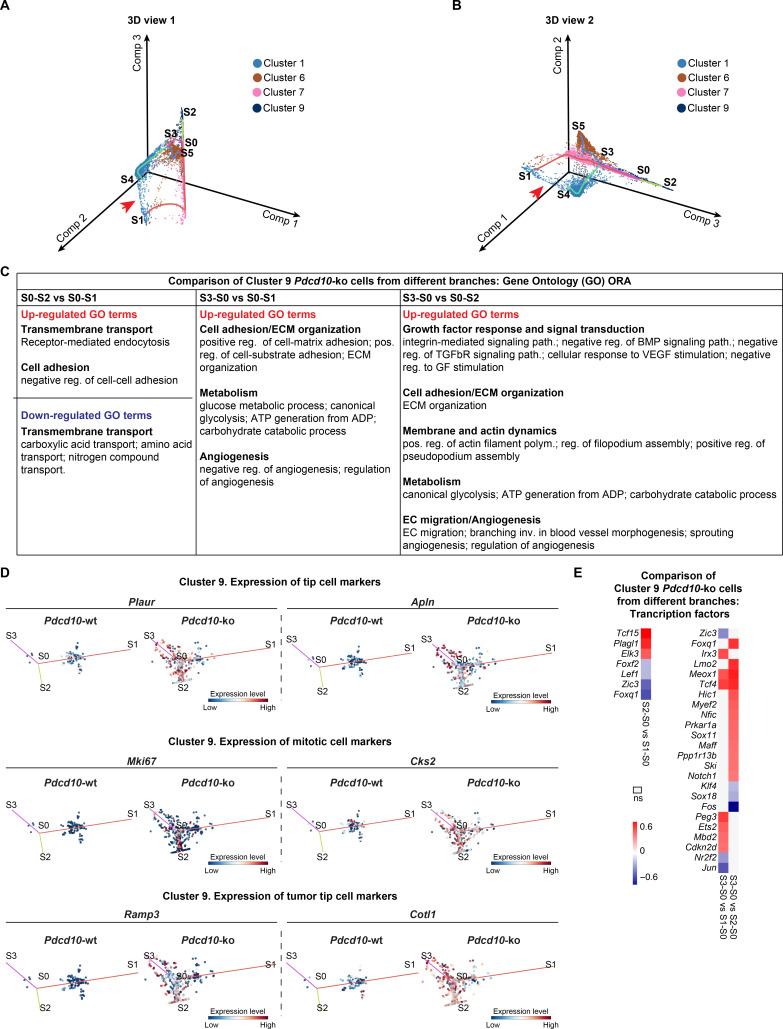
Figure 6—figure supplement 1. STREAM trajectory analysis of C9 Pdcd10-ko cells from different branches for the expression of functions (GO) and tip, mitotic and transcription factor genes.

Figure 6—figure supplement 1.

(A, B) STREAM trajectory inferred for Pdcd10-wt and Pdcd10-ko cells of the most affected clusters of C1, C6, C7, and C8, color coded as indicated. Two three-dimensional views (A, B) of the trajectories generated by STREAM are shown. Red arrows, small subset of cells belonging to C1 that bridge the ends of the S0–S1 and S4–S3 branches. Comp: principal components. (C) Pdcd10-ko cells of cluster 9 were distributed over different branches of the trajectory (S3–S0, S0–S2, S0–S1), as shown in Figure 6B,C. Multiple comparisons were performed, as indicated, to calculate differentially expressed genes between these three branches. Over-representation analysis (ORA) of the up-regulated (red text) and down-regulated (blue text) differentially expressed genes (average |logFC| ≥ 0.25, padj <0.05) for the Gene Ontology (GO) biological processes. GO-terms were functionally grouped as shown in bold text. (D) Flat tree view showing expression levels for Pdcd10-wt (left) and Pdcd10-ko (right) cells from cluster nine only, for representative tip, mitotic, and tumor tip cell markers. Dots are color coded for expression levels (blue, low; red, high). (E) Heatmaps of average logFC (p<0.05) for transcription factors calculated from the comparisons in (C). Left: comparison of S0–S2 versus S0–S1; right: comparison of S3–S0 versus S1-S0 (left) and S2-S0 (right).
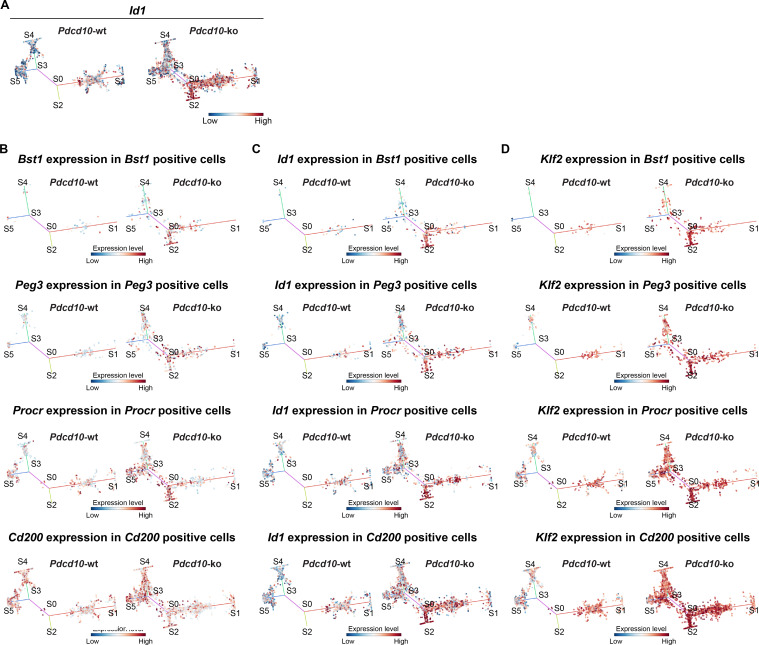
Figure 6—figure supplement 2. STREAM trajectory analysis of resident endothelial progenitor cells from different branches for the expression of the CCM-related genes Id1 and Klf2.

Figure 6—figure supplement 2.

(A) Flat tree views showing expression levels for Pdcd10-wt (left) and Pdcd10-ko (right) cells of Id1. (B–D) Flat tree views showing expression levels for Pdcd10-wt (left) and Pdcd10-ko (right) cells for each progenitor subpopulation investigated (B-D, top to bottom: Bst1+, Peg3+, Procr+, Cd200+) for the expression levels of the corresponding identifier genes (B), and for Id1 (C) and Klf2 (D) in each of the progenitor subpopulations investigated. Dots are color coded for expression levels (blue, low; red, high).