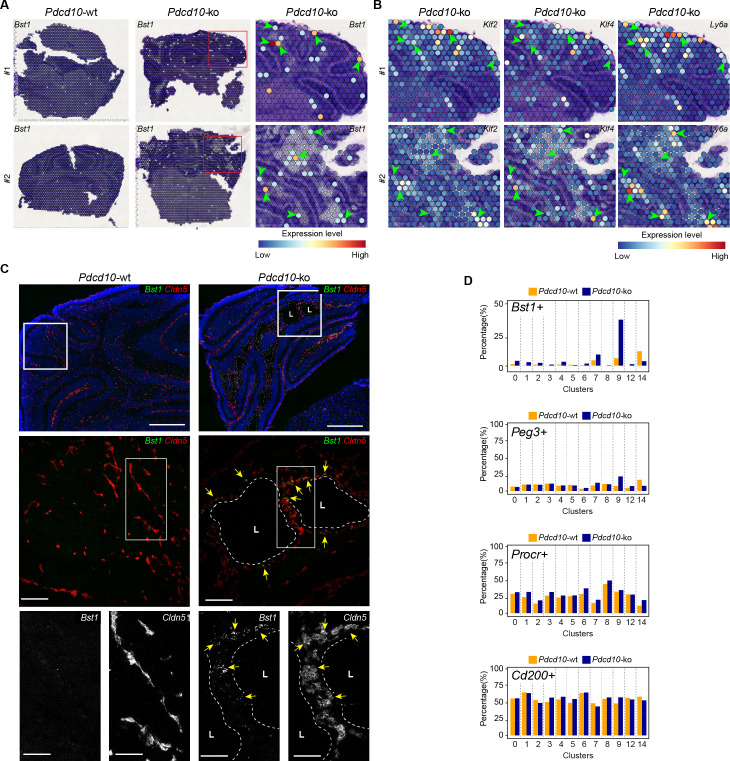
Figure 7. Venous-resident Pdcd10-ko endothelial progenitor cells support the formation of cavernomas.
(A) Expression levels of Bst1 as measured according to Visium Spatial Transcriptomics. All of the sequenced dots are shown, color coded for expression, as blue, low; red, high. Negative spot outlines are shown without any fill color to allow the visualization of underlying H and E staining (dark and light violet). Both complete sections and magnified boxed areas are shown. Arrowheads, examples of positive spots. (B) Expression levels of representative lesion markers (as indicated) from Visium analysis. For each gene and for each sample, the same magnified areas are shown as in (A). Arrowheads, same spots as indicted in (A). (C) Representative in-situ hybridization for Bst1 (green) and Cldn5 (red) using the RNA-Scope assay for Pdcd10-wt and Pdcd10-ko mouse cerebellum at P8. Three magnifications are shown (increasing top to bottom). Top: DAPI staining (blue) is also shown. Bottom: Cldn5 and Bst1 shown separately (white). Yellow arrows points to colocalization of Cldn5 and Bst1 signals. Lesion lumens (L) are outlined by white dashed lines. Scale bars: 500 μm (left), 100 μm (middle), 50 μm (right). (D) Plots of percentages (%) of cells positive for progenitor cell markers Bst1, Peg3, Procr, and Cd200 (as indicated) for Pdcd10-wt (orange) and Pdcd10-ko (blue) cells of each cluster. See Materials and Methods for definition of positive cells.

