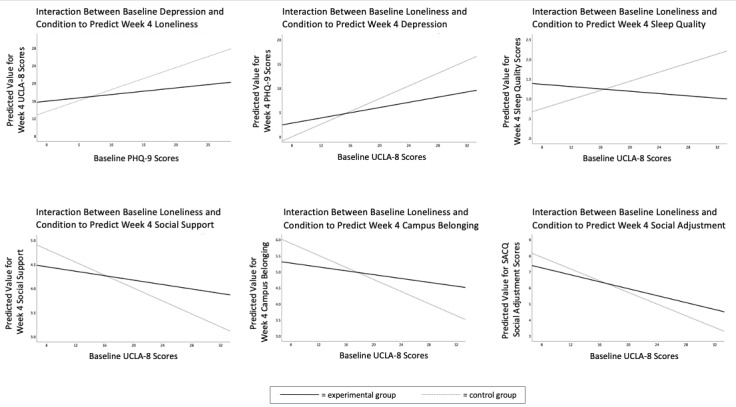
Figure 2.

Simple slopes of baseline vulnerability on select week-4 mental health and college adjustment outcomes in the experimental vs control groups. All graphs represent complete case analyses. Higher sleep quality scores indicate lower quality sleep. UCLA-8: UCLA Loneliness Scale, 8-item; PHQ-9: Patient Health Questionnaire 9-item; SACQ: Student Adaptation to College Questionnaire.
