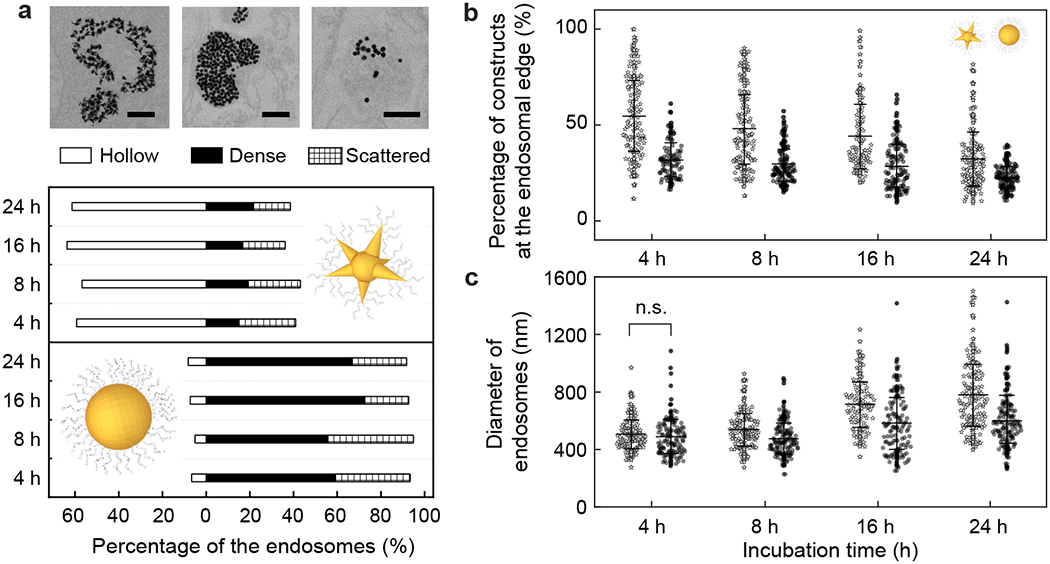
Figure 2. Hollow endosomes have a higher percentage of CpG-constructs along the endosomal edge and are larger than dense endosomes.

(a) Endosomes are classified by the CpG-construct distributions within them (hollow, dense, and scattered) after different incubation times (4, 8, 16, and 24 h; [CpG] = 200 nM). Scale bars = 200 nm. (b) Percentage of constructs along the endosomal edge and (c) diameter of endosomes were quantified. These characteristics of endosomes with different types of CpG-constructs show statistically significant differences (p < 0.0001, student’s t test) – otherwise marked with “n.s.” (not significant). Error bars in (b) and (c) indicate one standard deviation. All experiments were repeated at least twice.
