Fig. 4.
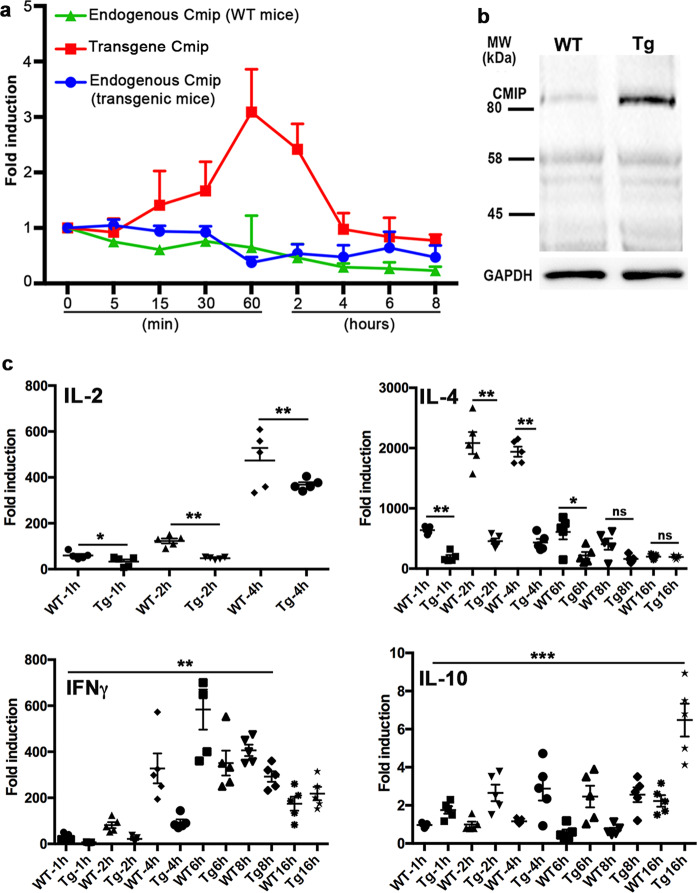
Influence of CMIP induction on cytokine expression. a Expression of the CMIP transcript. Total RNA was extracted from synchronized T cells before and after CD3/CD28 stimulation (1 μg/ml each) at the indicated times. The expression of endogenous Cmip in WT (green) and Tg mice (blue) along with Tg Cmip (red) is shown. b Expression of CMIP protein under the same conditions. c IL-2, IFNγ, IL-4, and IL-10 transcripts were quantified by RT-qPCR. The results are representative of three independent experiments (n = 5 mice in each group). [Tg vs. WT, mean with SEM; IL-2, 1 h: *p = 0.0278, 2 h: **p = 0.0040, 4 h: **p = 0.0040; IL-4, 1 h: **p = 0.0040, 2 h: **p = 0,0040, 4 h: **p = 0,0040, 6 h: *p = 0.0278, 8 and 16 h: nonsignificant (ns); IFNγ, 1 h: *p = 0.0257, 2 h: **p = 0.0040, 4 h: **p = 0.0079, 6 h: *p = 0.0317, 8 h: *p = 0.0317 and 16 h: p = 0.532 (ns); IL-10, 1 h: *p = 0.0286, 2 h: *p = 0.0159, 4 h: p = 0.1508 (ns), 6 h: *p = 0.0159, 8 h: **p = 0.0079, 16 h: **p = 0.0079; Mann-Whitney tests]

