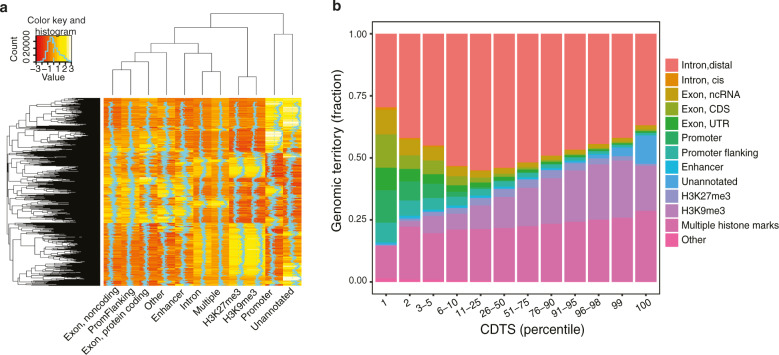
Fig. 2. CDTS for genomic elements.
a The relative sequence composition (k-mers) for different genomic elements is shown by red and yellow shaded heatmap. Heptamers are presented in rows and ordered by hierarchical clustering. The relative abundance of each heptamer is compared horizontally across the genomic elements, with the shades of red and yellow reflecting the z scores. b The cumulative territory fraction covered by each element family is shown by the bar plot in different percentile slices (1–100) based on the rank of CDTS values. The ensemble element families that were not included in substantial parts of the genome are represented as others.

