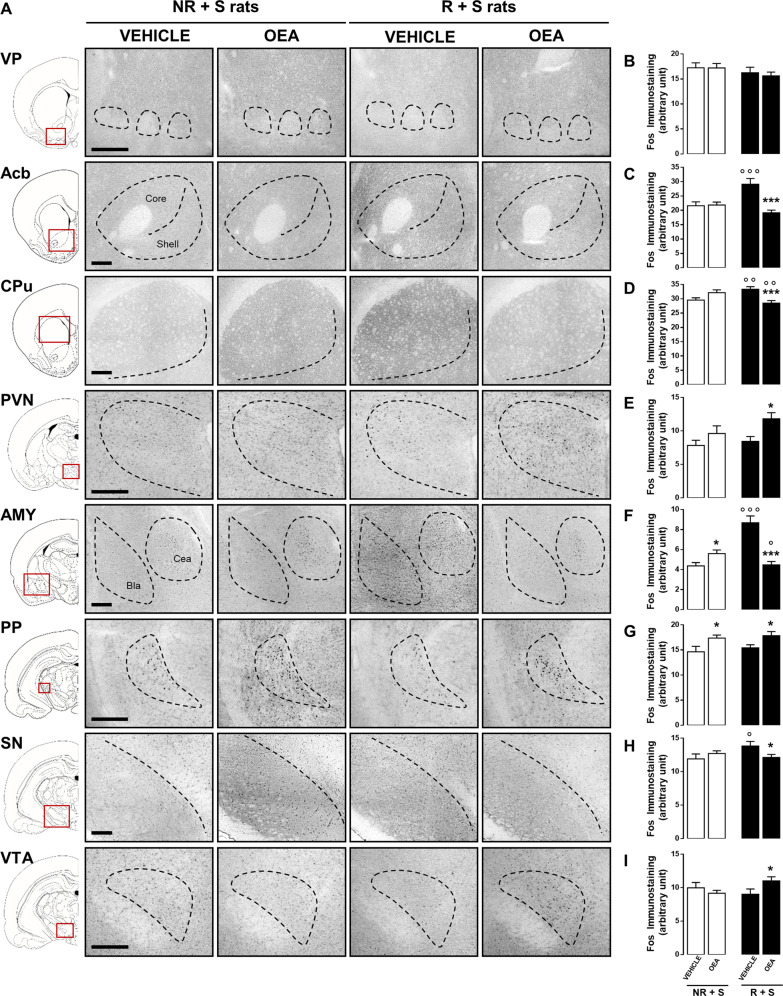
Fig. 2. OEA treatment affected the brain pattern of c-Fos expression in bingeing rats.
Representative photomicrographs (scale bar = 500 μm, a) showing c-Fos immunostaining within the ventral pallidum (VP), nucleus accumbens (Acb), caudate putamen (CPu), paraventricular nucleus (PVN), amygdala (AMY), pedunculopontine nucleus (PP), substantia nigra (SN), and ventral tegmental area (VTA) in brain slices collected from both NR + S (non restricted + stressed) and R + S (restricted + stressed) rats treated with either vehicle (veh) or OEA (10 mg kg−1, i.p.) and sacrificed 120 min after treatment. Semiquantitative densitometric analysis of c-Fos expression within the VP (b), Acb (c), CPu (d), PVN (e), AMY (f), PP (g), SN (h), and VTA (i) of NR + S and R + S rats treated with either veh or OEA (10 mg kg−1, i.p.) and sacrificed 120 min after treatment. Data are expressed as mean ± SEM. *P < 0.05; ***P < 0.001 vs veh in the same diet regimen group; °P < 0.05; °°P < 0.01; °°°P < 0.001 vs NR + S in the same treatment group (Tukey’s post hoc test, N = 3).

