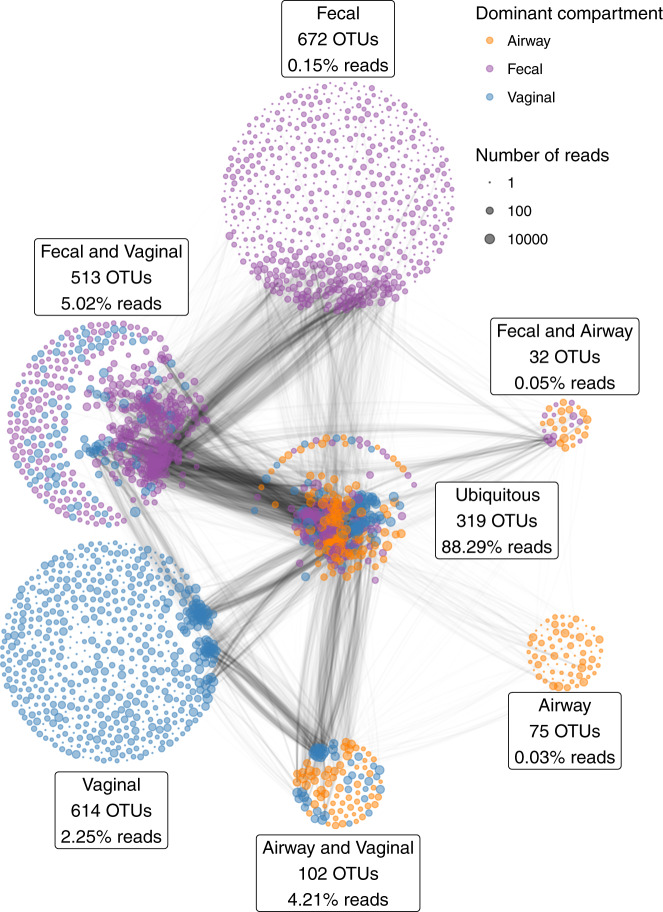
Fig. 1. The number of shared and distinct OTUs between vaginal (blue), 1-week fecal (purple) and 1-week airways (yellow) (of a total of 2327 OTUs).
The percentages indicate the relative number of reads of the partition; i.e., the 319 ubiquitous OTUs account for a total of 88.3% of the reads. The edges between the OTUs indicate the pairwise correlations (r) reflecting the co-occurrence based on a correlation network analysis on each compartment separately, using the highest value among the three compartments. The thickness of the edge corresponds to the maximum pairwise correlation across compartments. Only r > 0.2 are plotted.

