
Fig. 2. Temporal changes of Bray–Curtis distance between two successive days of age at sampling in gut microbiota.
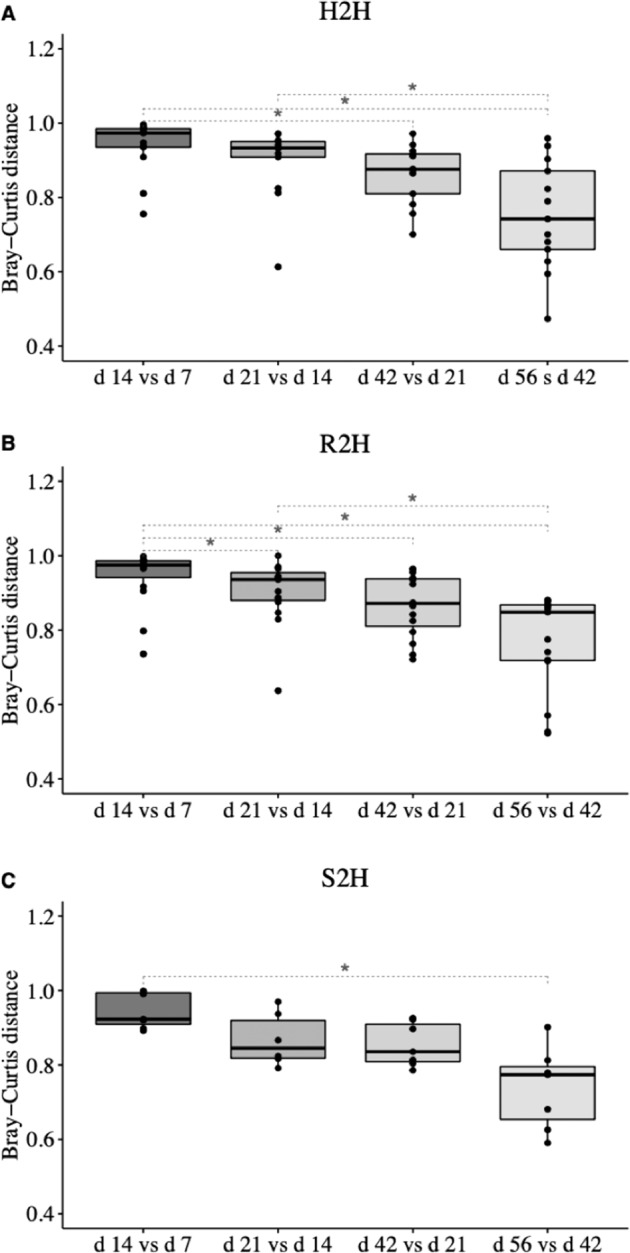
a Calves that never exhibited diarrhea (H2H); b calves that exhibited diarrhea but not treated with Trimidox or Excenel (R2H); c calves that exhibited diarrhea and treated with Trimidox or Excenel (S2H). Statistical analysis was done by Friedman test and multiple comparisons were performed based on Wilcoxon signed-rank test and subjected to “BH” P value adjustment (*P ≤ 0.05).