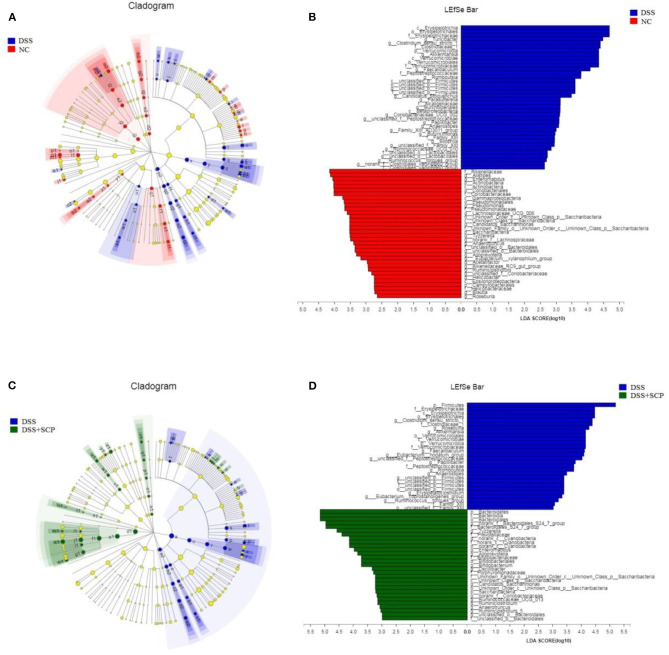
Figure 8.
(A–D) Cladograms indicating the polygenetic distribution of bacterial lineages associated with the different groups. Indicators between inner and outer mangrove sediments with LDA score larger than 2.5. LEfSe provided the features that are differential bacterial taxa ranking according to the effect size. Different color nodes represent the microbial groups that are significantly enriched in corresponding groups and have significant influence on the differences between groups. The light yellow node indicates the microbial groups that have no significant difference in different groups or have no significant influence on the differences between groups.

