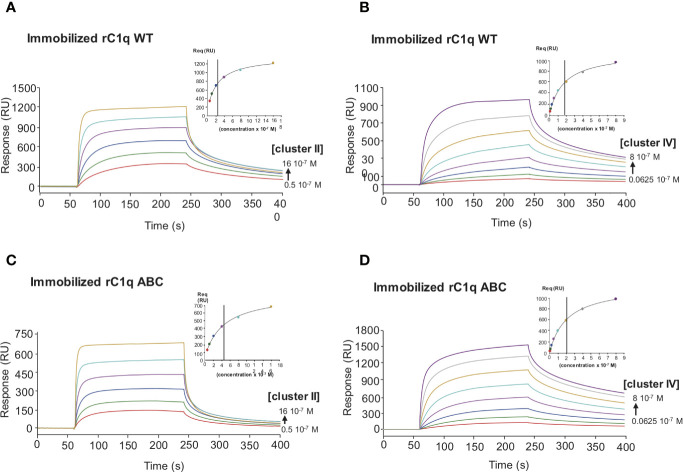
Figure 7.
Comparative kinetic analysis of the interaction of LRP1 clusters II and IV with immobilized recombinant C1q variants. LRP1 clusters II (left panels) and IV (right panels) were injected at indicated concentrations over immobilized recombinant C1q (rC1q WT, 11,000 RU, A, B panels) or C1q mutant LysA59Ala/LysB61Ala/LysC58Ala (rC1q ABC, 12,300 RU, C, D panels) in 50 mM Tris, 150 mM NaCl, 2 mM CaCl2, 0.05% P20, pH 7.4. The Req versus concentration plots of steady state fittings are shown on the top right of the SPR curves. KD values (means ± SD) for each kinetics are summarized in Table 2.

