
Fig. 1.
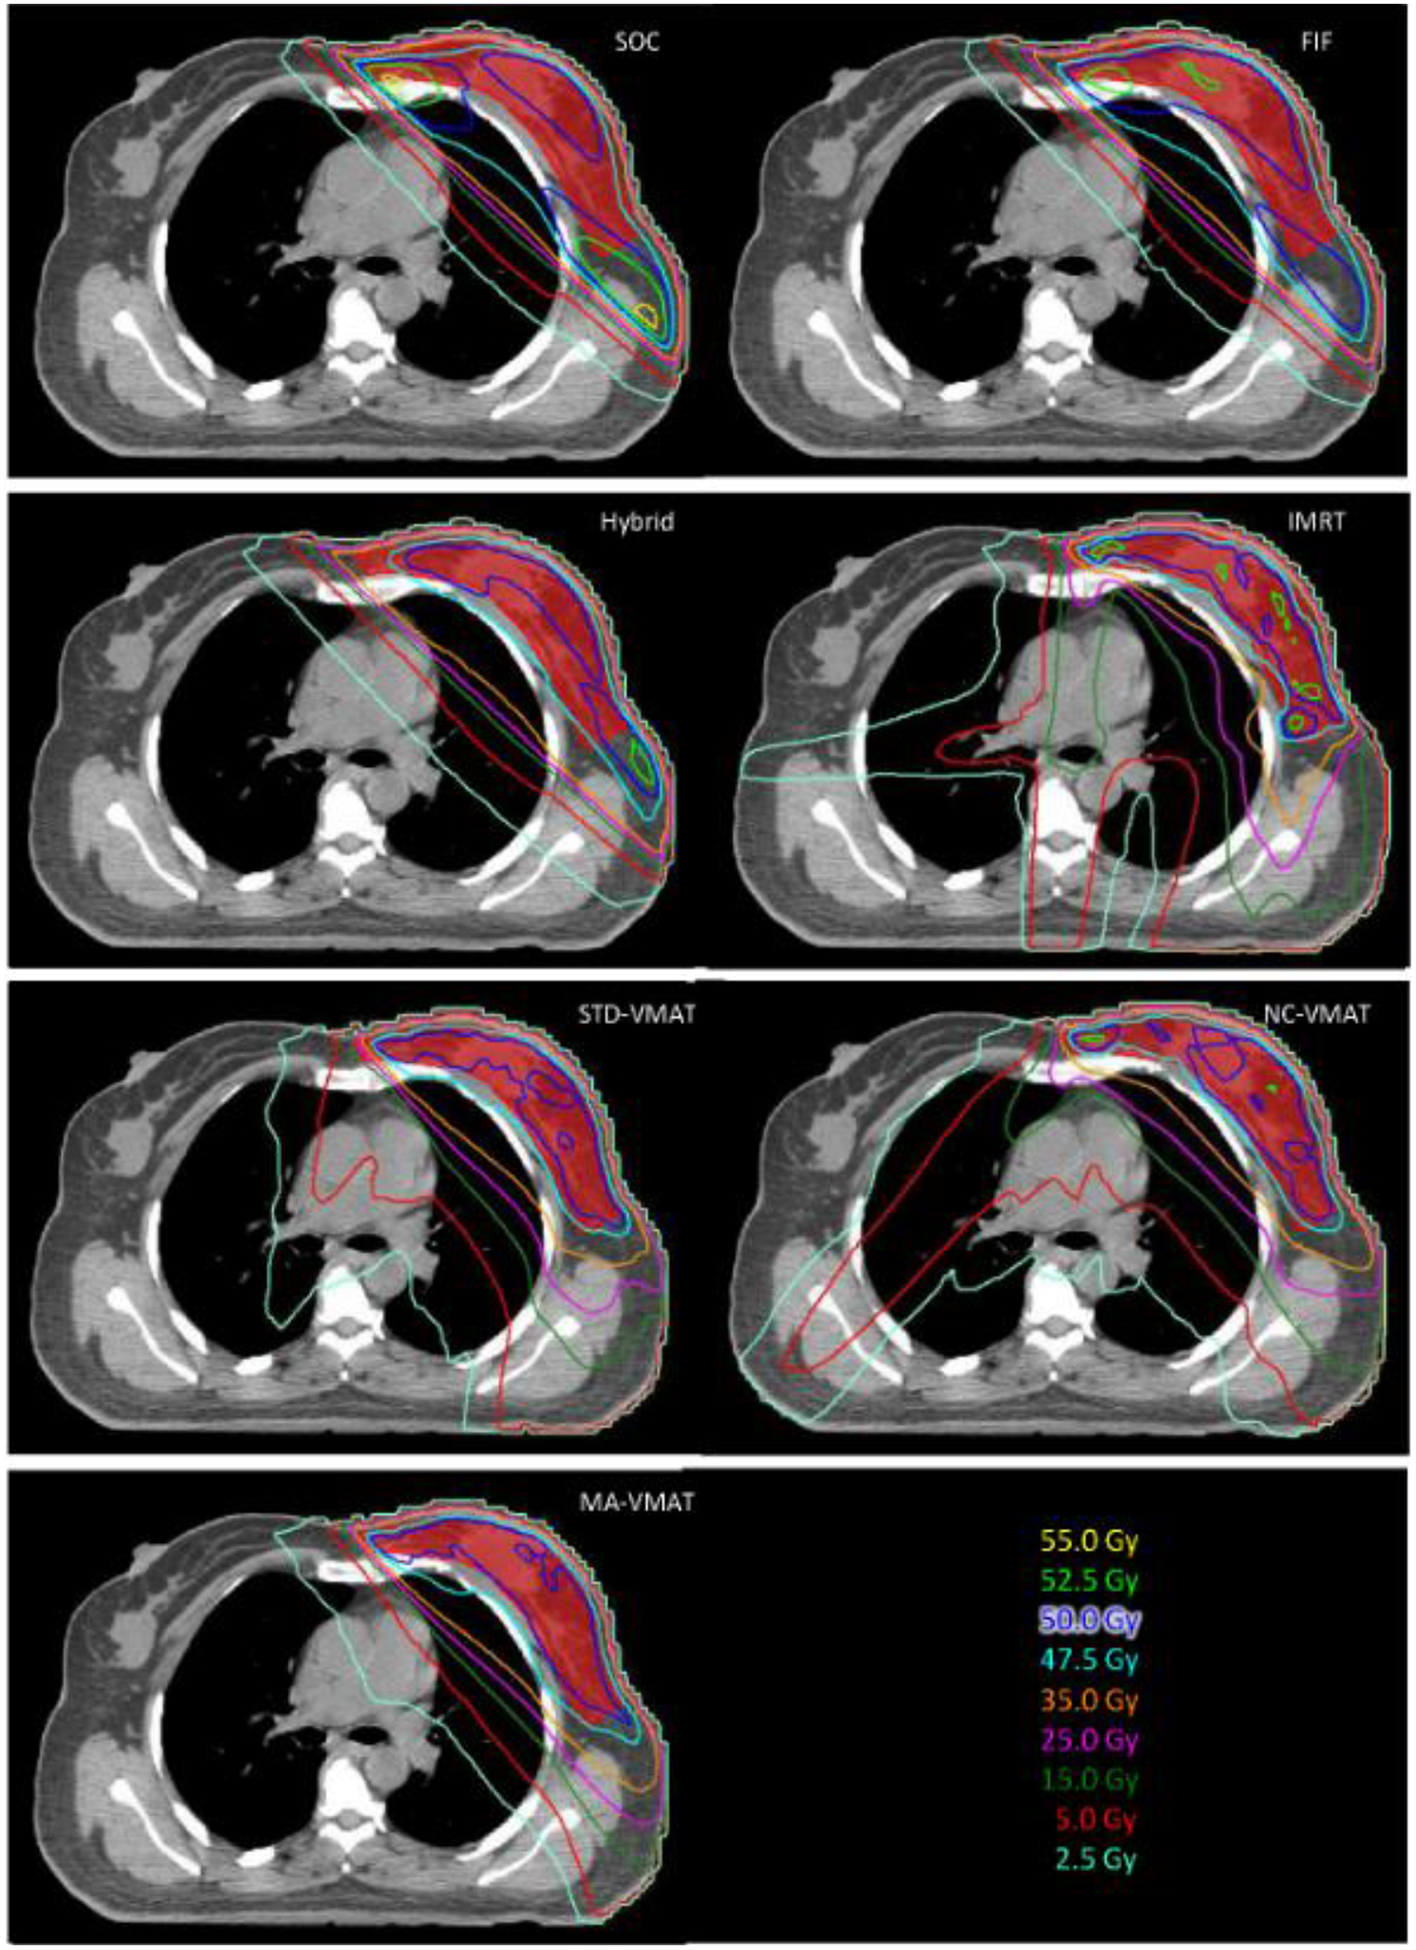
Axial view of isodose distribution for SOC, FIF, Hybrid IMRT, IMRT, STD-VMAT, NC-VMAT and MA-VMAT plans for a typical WBRT patient. The red color wash represents the PTV-Eval.
Official websites use .gov
A
.gov website belongs to an official
government organization in the United States.
Secure .gov websites use HTTPS
A lock (
) or https:// means you've safely
connected to the .gov website. Share sensitive
information only on official, secure websites.
Axial view of isodose distribution for SOC, FIF, Hybrid IMRT, IMRT, STD-VMAT, NC-VMAT and MA-VMAT plans for a typical WBRT patient. The red color wash represents the PTV-Eval.