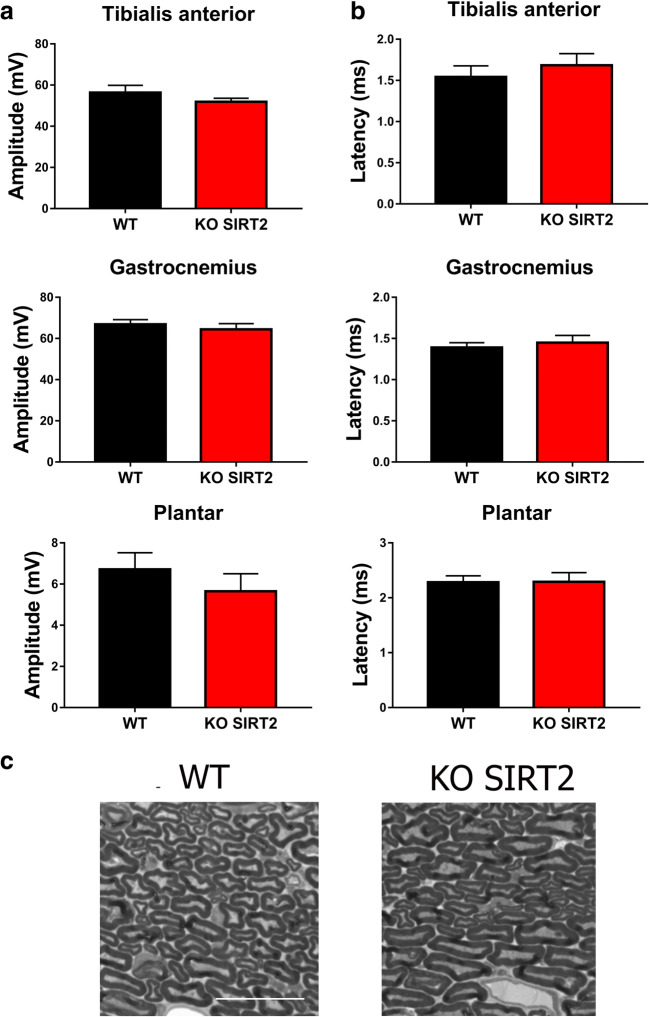
Fig. 3.
(A) Mean values of the amplitudes and latencies (± SEM) from CMAP recordings obtained at tibialis anterior (TA), gastrocnemius (GA), and plantar muscles in wild type (WT) or SIRT2 KO mice (n = 6 animals per group). (B) High-magnification images of semithin sections of the contralateral sciatic nerve from the WT and SIRT2 KO mice. Scale bar = 20 μm

