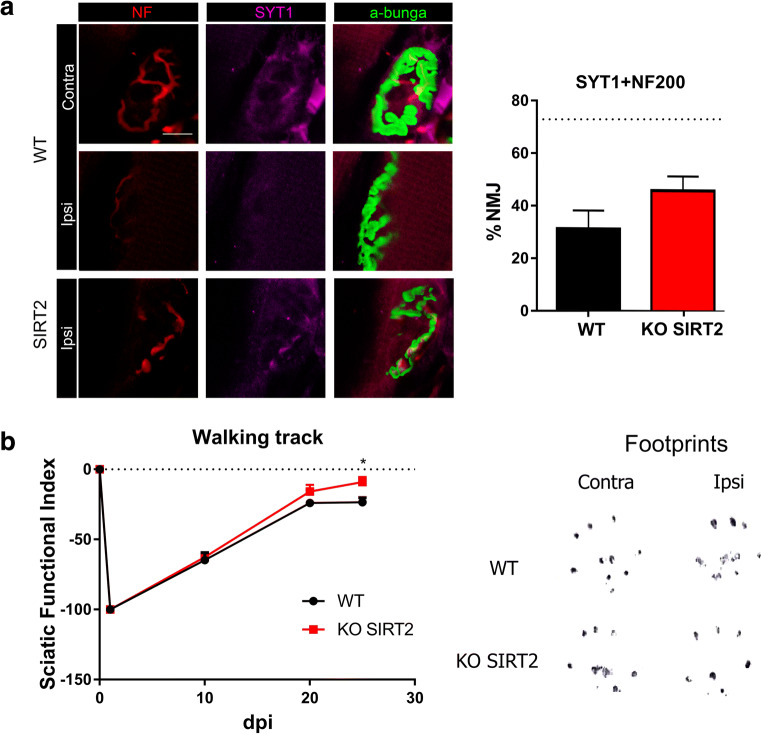
Fig. 5.
(A) Representative microphotographs with immunolabeling against syntaxin 1 (SYT1, magenta) and neurofilament (NF, red) in α-bungarotoxin-labeled (a-bunga, green) neuromuscular junctions (NMJs), and a bar graph of the average percentage of reinnervated NMJs (red, green, and magenta overlapping signal) at 30 days post injury (dpi) in both experimental groups. The dotted line indicates the mean number of reinnervated NMJs in wild type (WT) uninjured animals. (n = 4, t test, *P < 0.05 vs. WT). Scale bar = 10 μm. (B) Left: plot of the sciatic functional index (SFI) obtained with walking track analysis after sciatic nerve crush in WT or SIRT2 KO animals (n = 6 animals per group, ANOVA, post hoc Bonferroni, *P < 0.05 vs. WT). Right: representative footprints from ipsi- and contralateral paws at 30 dpi

