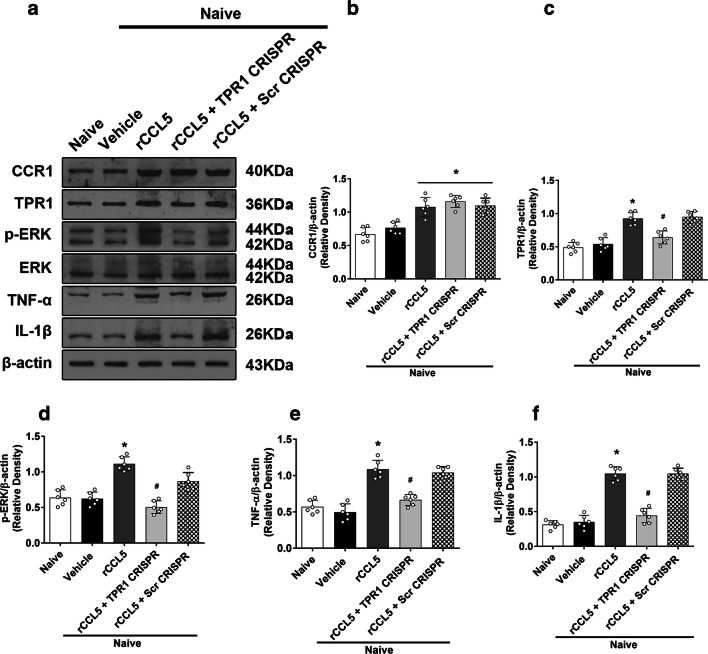
Fig. 7.
The effects of rCCL5 and TPR1 CRISPR on the expression of CCR1 and its downstream signaling proteins in naïve mice. a Representative Western blot bands. b–f Quantitative analyses of CCR1, TPR1, p-ERK1/2, IL-1β, and TNF-α in the ipsilateral hemisphere at 24 h after rCCL5 administration in naïve mice. *p < 0.05 versus naive + vehicle and #p < 0.05 versus naive + rCCL5 + scr CRISPR. Error bars are represented as mean ± SD. One-way ANOVA, Tukey’s test, n = 6 per group

