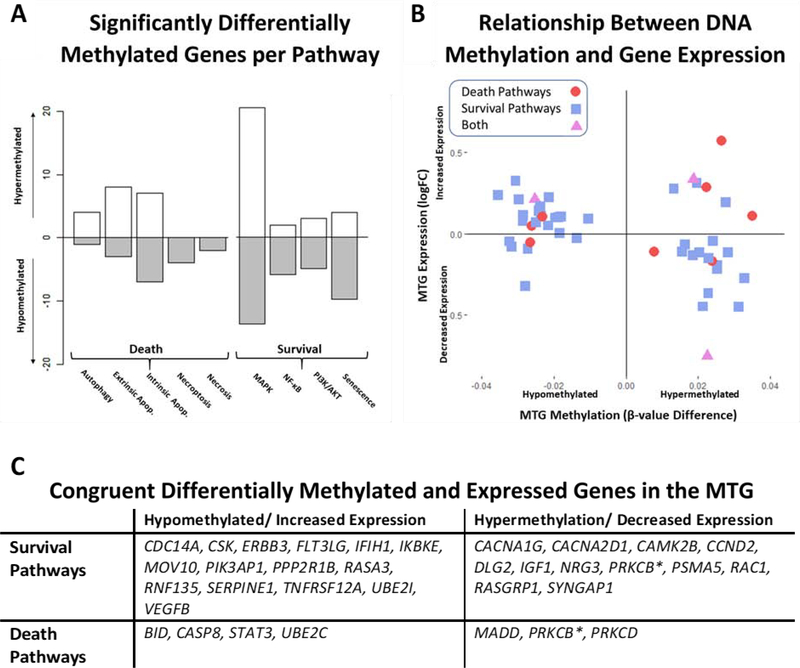
Fig 2.
Integration of Middle Temporal Gyrus Methylation and Expression Data. Relative methylation changes per pathway are represented in Figure 2A for all genes associated with a statistically significant differentially methylated CpG (FDR < 0.05). Hypomethylated genes (AD methylation < ND) are counted below the x-axis while hypermethylated genes (AD > ND) are reported above. Figure 2B is a scatterplot of 49 genes that are both significantly differentially methylated and expressed (FDR < 0.05) in the AD middle temporal gyrus. Genes are shaped and colored depending on pathway type (death = red circles; survival = blue squares; both = purple triangles). The relationship between methylation (hyper- or hypomethylated) and expression (increased or decreased) is significantly correlated for this subset of genes (Pearson’s r = −0.32, p-value = 0.0234). A table of congruent significant genes (hypermethylated and decreased expression or hypomethylated and increased expression) is provided in Figure 2C.

