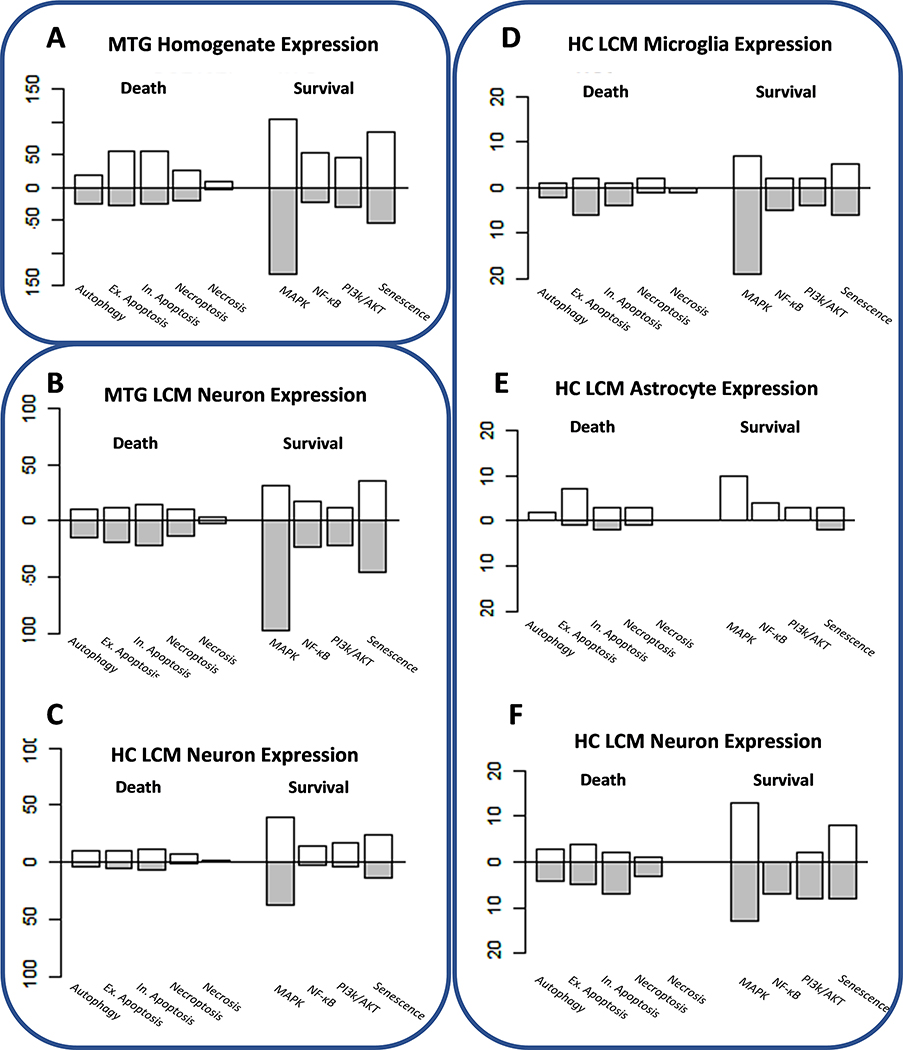
Fig. 3.
Gene Expression Changes in Middle Temporal Gyrus (MTG) and Hippocampus (HC) in AD. The bar plots represent number of genes with an increased (above the x-axis) or decreased (below) per pathway in AD. Results derived from the same study are encircled: MTG homogenate expression (GSEl32903) (Piras et al., 2019), LCM neuron expression from the MTG and HC (GSE5281) (Liang et al., 2007), and LCM glia and neuron expression from the HC(Mastroeni et al., 2017). Note that the significance cutoff for Figures 3A-C is FDR < 0.05 but, due to limited significant results in the HC glia and neurons, an unadjusted alpha of 0.05 was applied to genes in Figures 3D-F.

