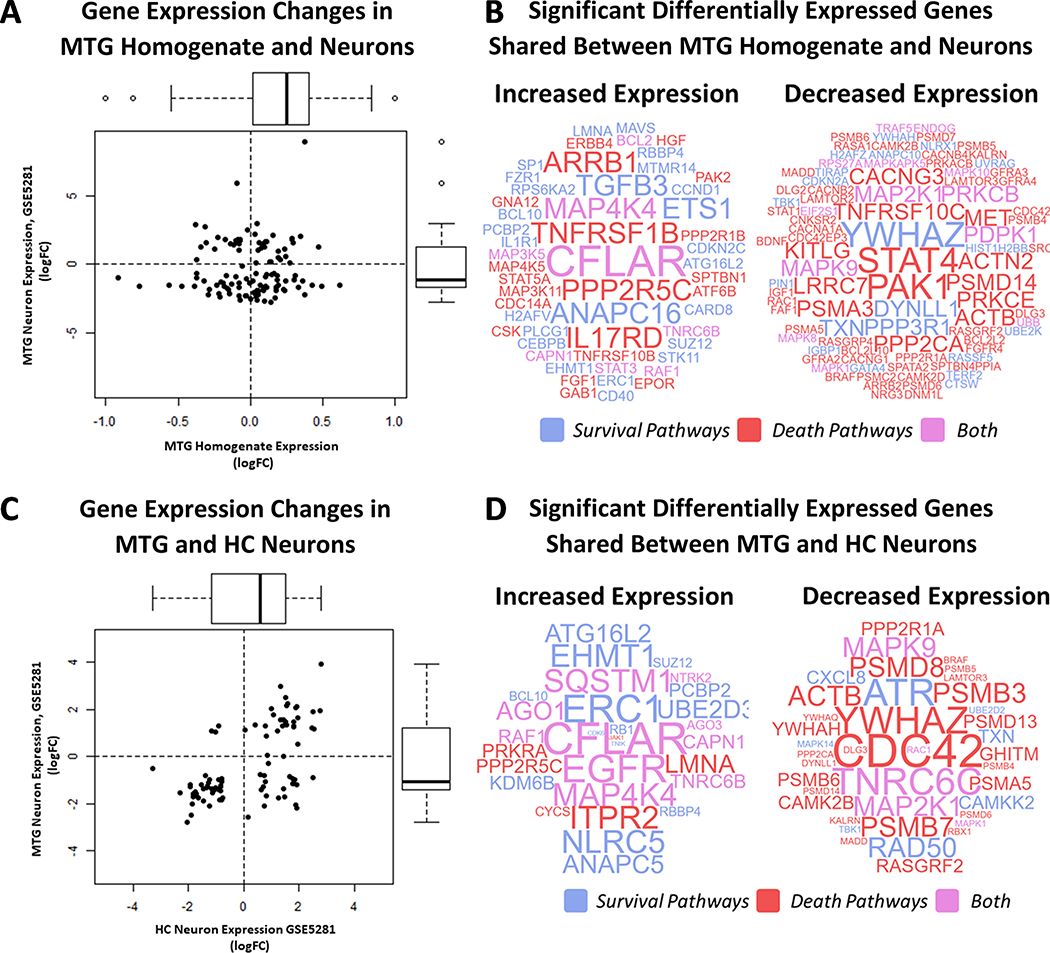
Fig 4.
Integration of Expression Data from the Hippocampus and Middle Temporal Gyrus. The log2 transformed fold-change (log2FC) of shared significant genes (adjusted p-value < 0.05) between MTG homogenate (GSE132903) and LCM MTG neurons (GSE5281) are significantly positively correlated (Pearson’s r = 0.6030; p-value < 2.2E-16) (Fig 4A). Genes with positively correlated expression (Q1 = increased and Q3 = decreased) are represented as word clouds in Figure 4B. Word color corresponds to gene pathway type (survival = blue, death = read, both = purple) and size is the product of the log2 fold change in between the datasets. Data are reported similarly for LCM MTG and HC neurons (GSE5281) (Fig 4C-D).

