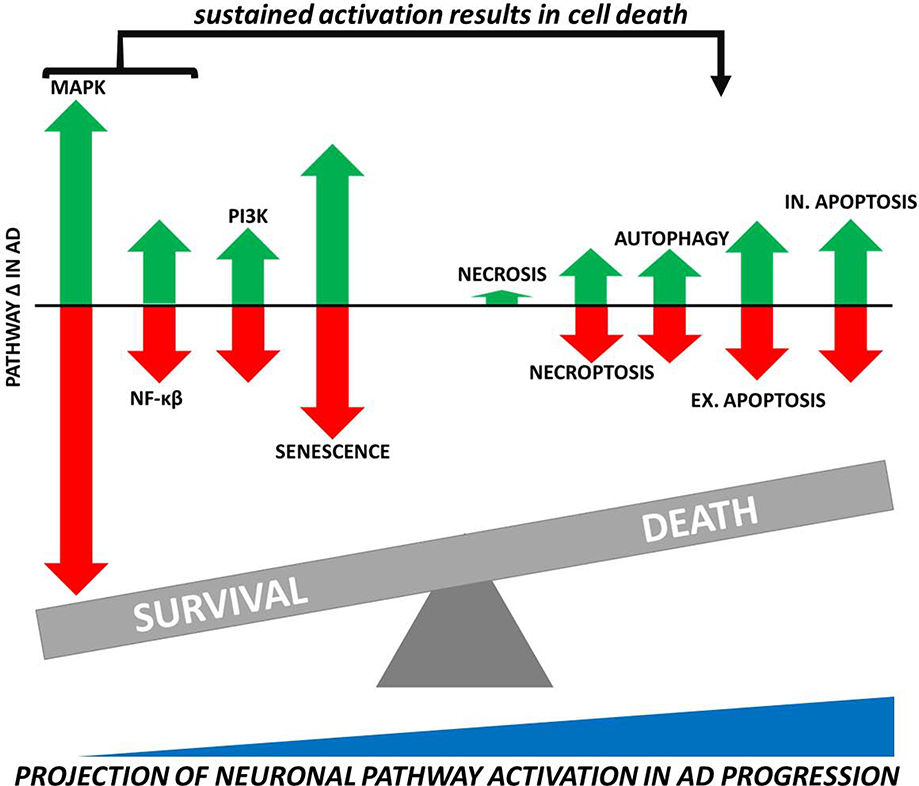
Fig 5.
Balance Between Cell Death and Survival Pathway Activation in AD Neurons. Arrows represent the relative contribution of pathway upregulation (represented by green arrows above the x-axis) and downregulation (red arrows below the x-axis) in AD neurons. The size of arrows is proportional to the average pathway contribution to total significant genes from the middle temporal gyrus homogenate methylation and expression results (Sections 3.1 and 3.2) in conjunction with those from LCM neurons (Section 3.3). On a cellular level, we hypothesize a transition from elevated survival to death pathway activity in AD neurons as the disease progresses—especially as the MAPK and NF-κβ pathways that, under acute stress conditions promote cell survival, are activated chronically and begin to favor neuron death.

