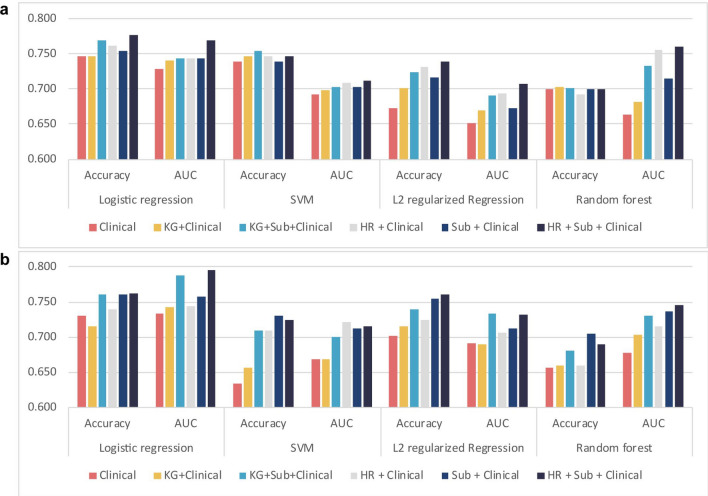
Figure 4.
Predictive performance for DFS and OS using various features. The performance of machine learning models for predicting (a) OS and (b) DFS based on various features were measured. The y-axis represents the accuracy or AUC values. Clinical, nine clinical data; KG, known cancer driver genes (KRAS, CDKN2A, TP53, and SMAD4); HR, a high-risk group of patients harboring mutations in five genes with high CP values; Sub, a feature representing subgroups generated by integrating mRNA, miRNA, and DNA methylation subtypes; AUC, area under the curve values from fivefold cross-validation.

