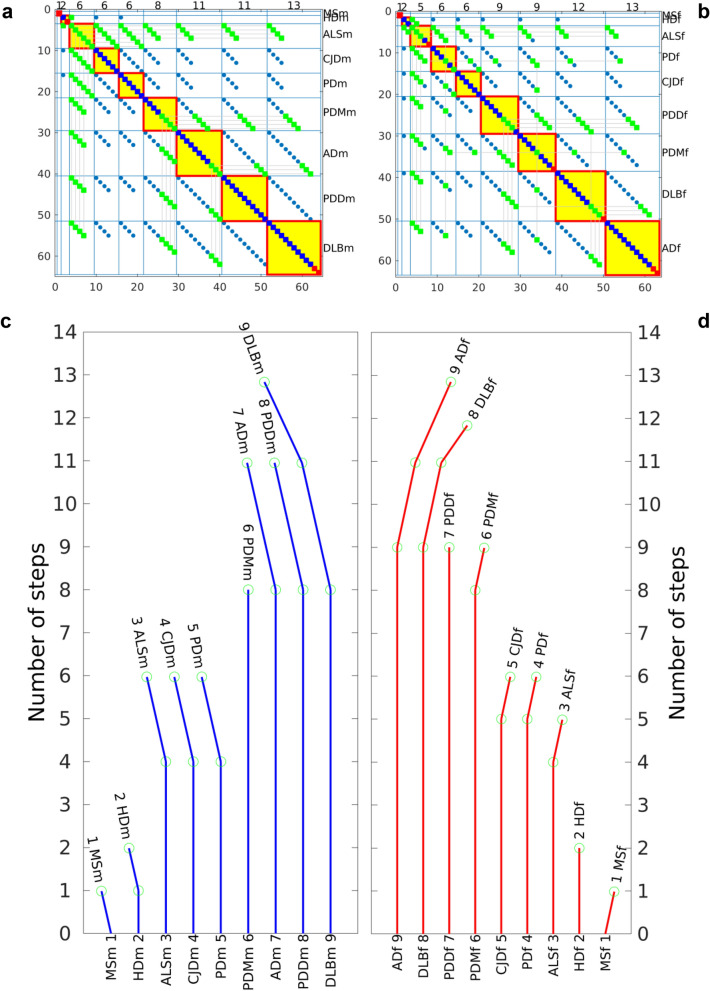
Figure 7.
Calculation of the tree of genealogy of neurodegenerative diseases (NDs). Spy of the adjacency matrix A before sorting for: (a) male and (b) female. Blue squares mark the steps in general. The green squares denote promoters of common steps. The promoters of common steps are marked only in the first disease where the step is found to be common but not in the remaining diseases with this common step. Promoter is the first common step found. Red squares mark the non-common steps. The red-bordered yellow squares mark the spy of the matrices used to position each ND on the tree of the genealogy of NDs. Number of steps and deflections calculated for each ND for: (c) male and (d) female.

