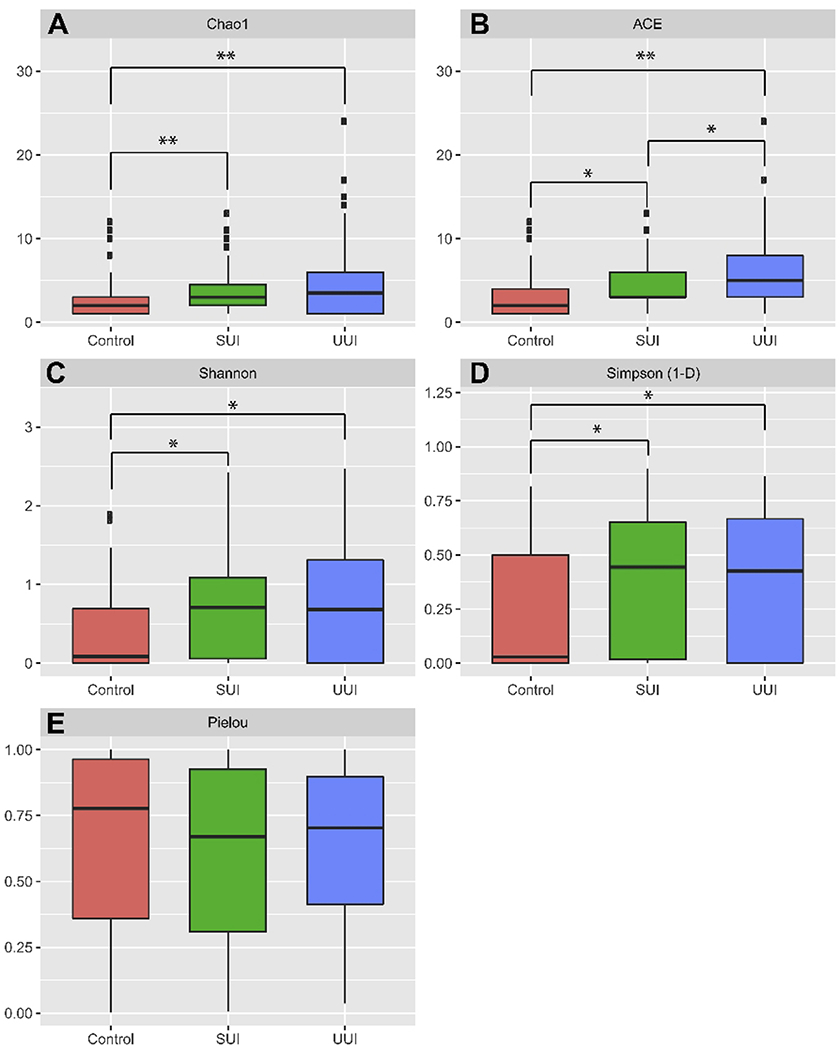
Figure 2. Alpha diversity values.

Boxplots depict the distribution of values for Control (red), SUI (green), and UUI (blue) cohorts calculated from EQUC data. A, Chao1; B, ACE; C, Shannon; D, Simpson (1-D); E, Pielou. Statistical significant comparisons after multiple test correction between group are denoted as *, < 0.05; **,< 0.001.
