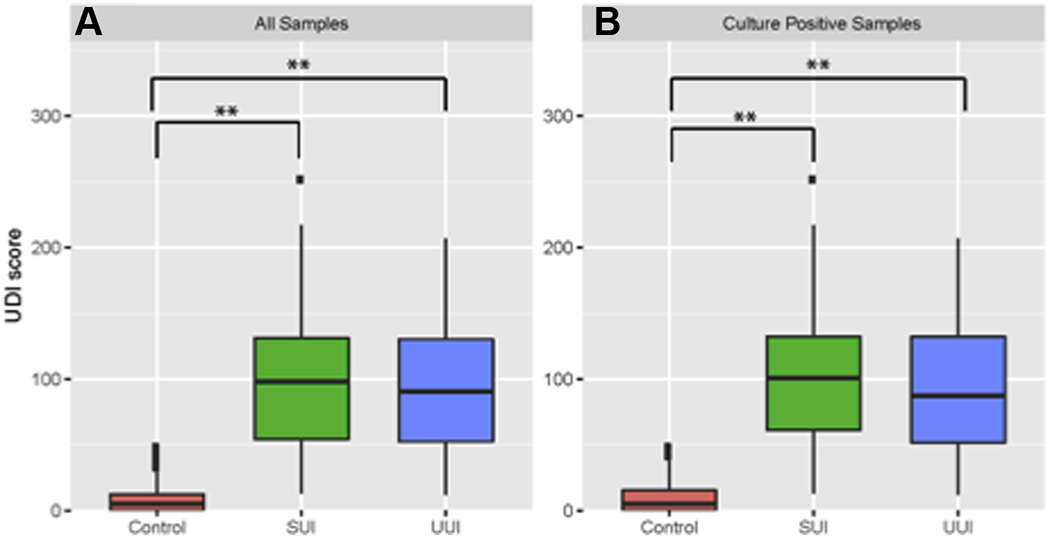
Figure 3. UDI score distribution among cohorts.

Boxplots depict the distribution of Urinary Distress Inventory (UDI) scores for Control (red), SUI (green), and UUI (blue) cohorts calculated from all patient samples. A, All Samples; B, Culture-positive only. Statistical significant comparisons after multiple test correction between group are denoted as *,< 0.05; **, < 0.001.
