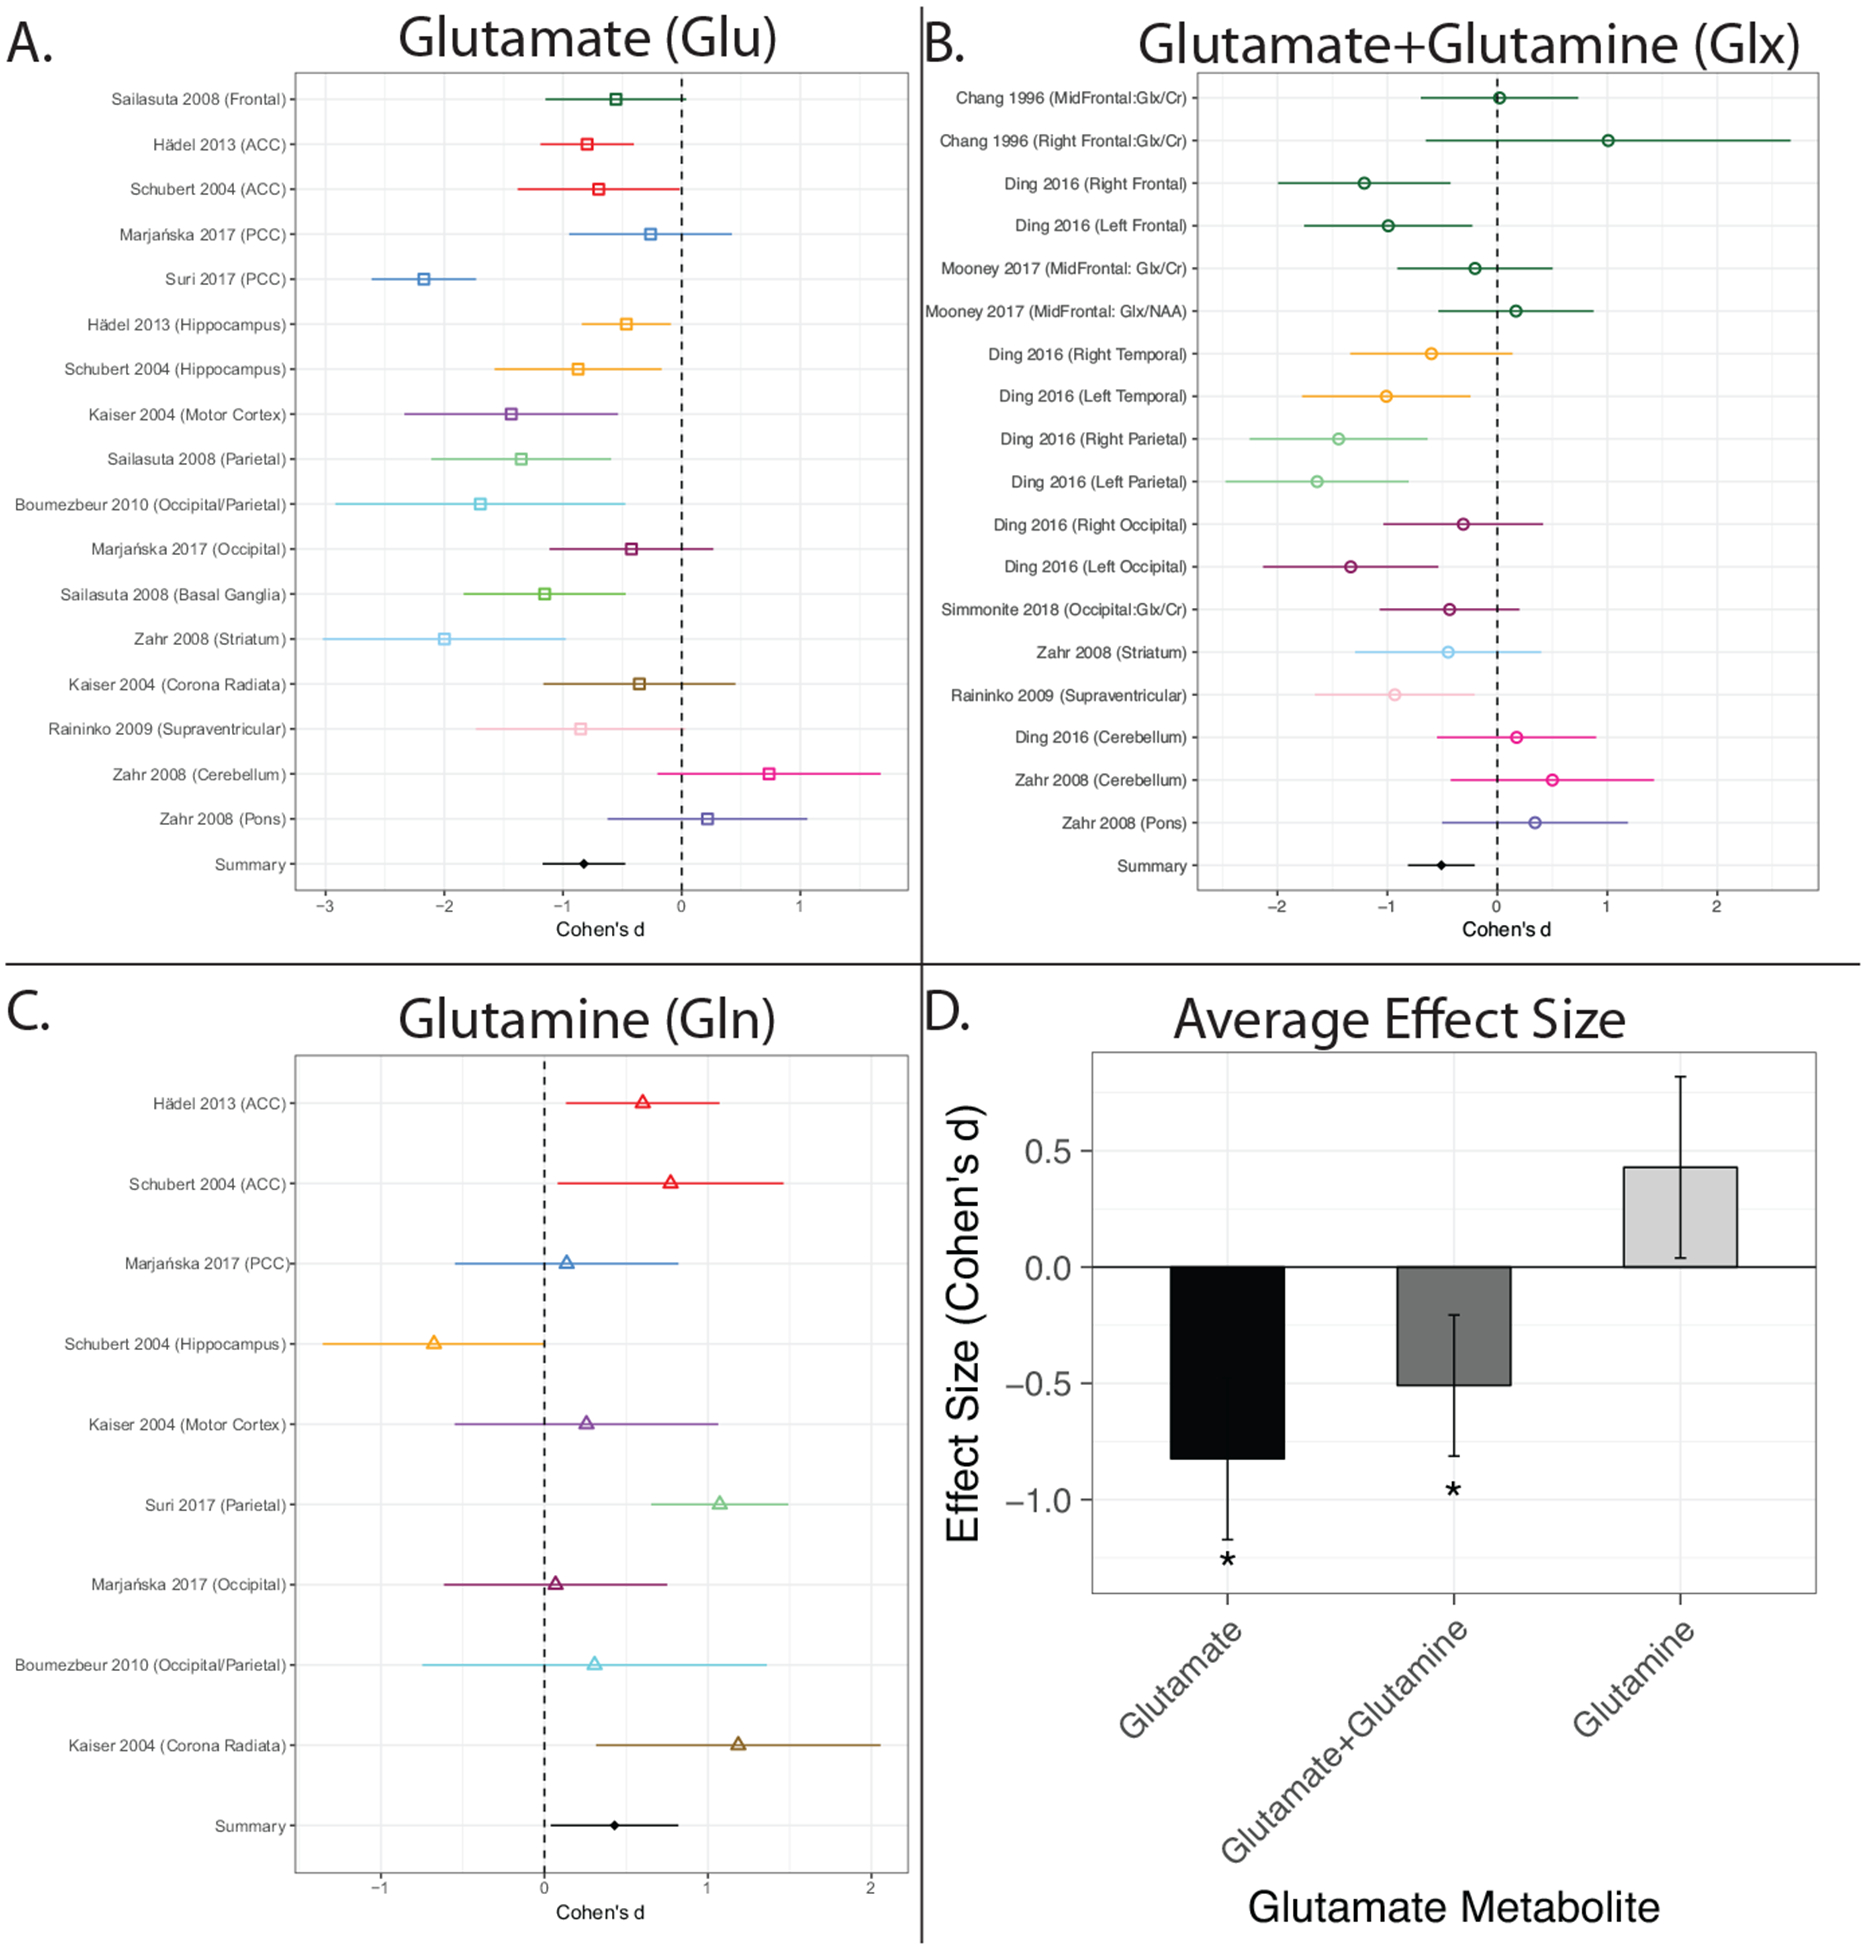
Figure 1. Individual study and average effect sizes displayed by 1HMRS metabolite type.

A-C: Effects sizes are shown separately for glutamate (A), glutamate+glutamine (B), and glutamine (C). Effects are shown as mean Cohen’s d (effect size) with corresponding 95% confidence intervals. (D). The meta-analytic derived average effect size ((+/ 95% CI) for each of the three metabolite types. Effects shown in A-C are ordered and colored by brain region. In all panels, negative effect sizes indicate lower metabolite levels in older compared to younger adults. *indicates significantly different than glutamine. ACC=Anterior Cingulate Cortex; PCC=Posterior Cingulate Cortex.
