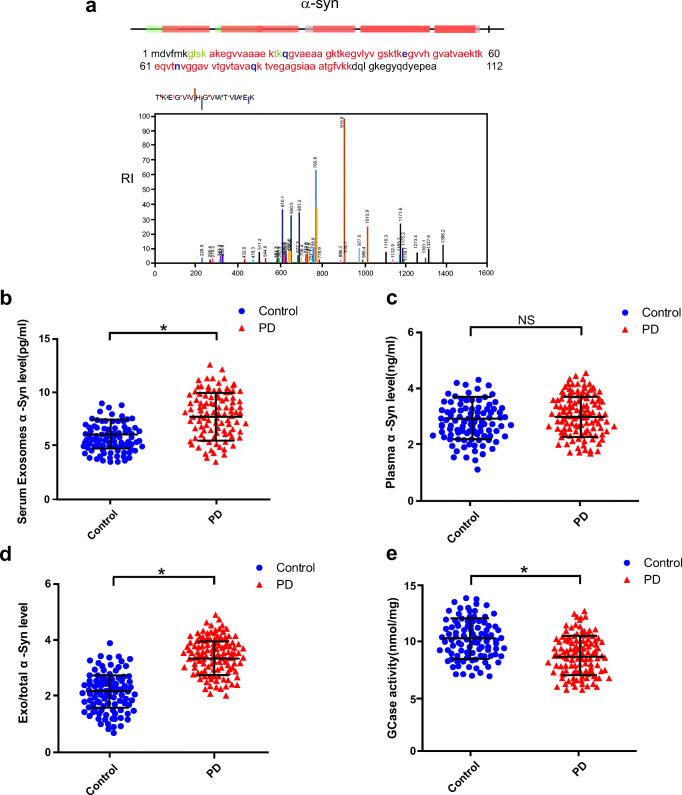
Fig. 3.
Plasma L1CAM exosomal α-syn and GCase activity in PD patients and control subjects. (A) Mass spectrometry identification of α-syn in L1CAM-containing exosomes isolated from human blood plasma. (B) Plasma L1CAM exosomal α-syn concentrations were measured using Quanterix Simoa. (C) Plasma α-syn level. (D) Exosomal/total α-syn ratio. (E) GCase activity level in PD patients and control subjects; *P < 0.05 by using the Mann–Whitney U test. The horizontal line and error bars represent the mean ± standard error

