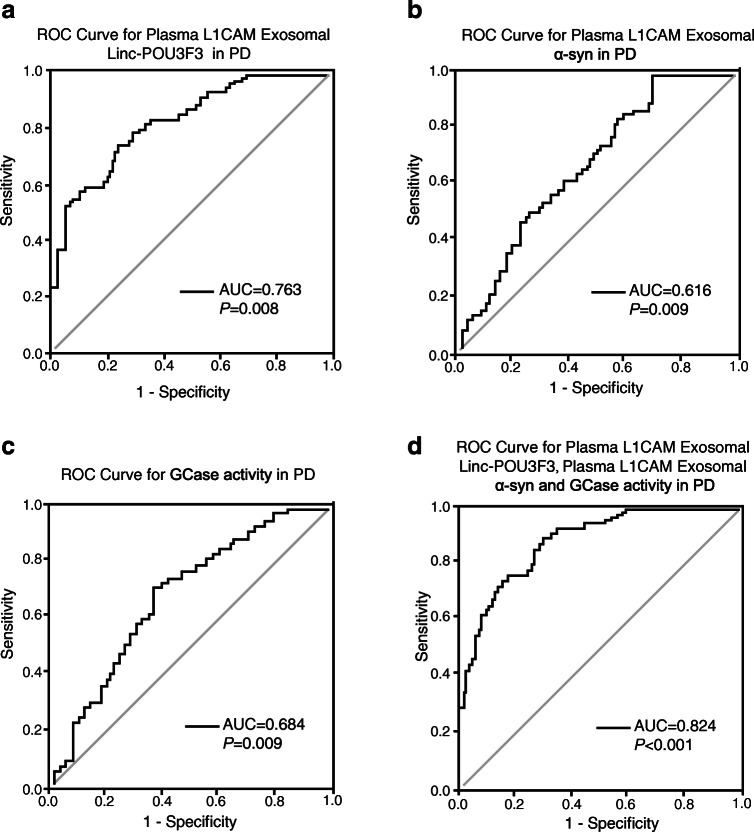
Fig. 5.
ROC curves to evaluate the utility of L1CAM exosomal Linc-POU3F3, L1CAM exosomal α-syn and GCase activity for the discrimination of PD patients from healthy controls. (A–D) The AUC of ROC curves for discrimination of PD patients from healthy controls (A) L1CAM exosomal Linc-POU3F3, (B) L1CAM exosomal α-syn, (C) GCase activity were 0.763 (95%CI: 0.650–0.809, P = 0.008), 0.616 (95%CI: 0.527–0.733, P = 0.009), and 0.684 (95%CI: 0.588–0.795, P = 0.009), respectively; The AUC of (D) L1CAM exosomal Linc-POU3F3+ L1CAM exosomal α-syn + GCase activity was 0.824 (95%CI: 0.739–0.915, P < 0.001)

