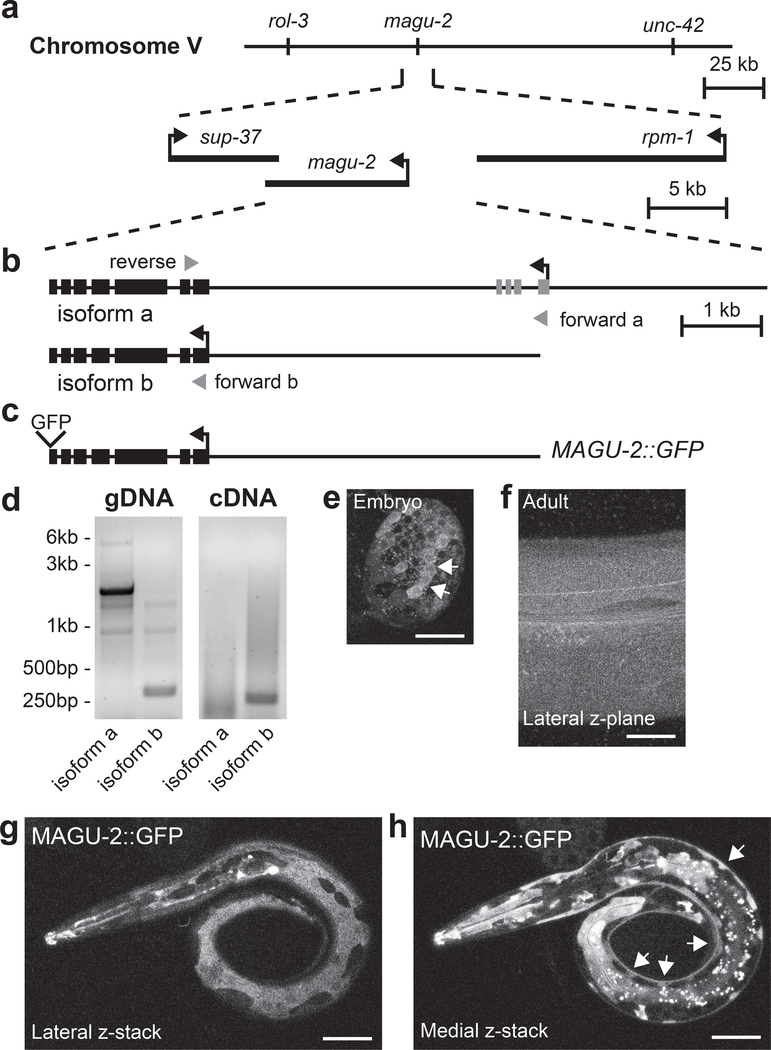
Figure 1. MAGU-2 is expressed in the epidermis.
(a) Diagram of the magu-2 genetic locus on chromosome V. The magu-2 gene is flanked by the neighboring genes, sup-37 and rpm-1. (b) Diagram of magu-2 gene structure representing the predicted a and b isoforms. Gray arrowheads indicate primers used for isoform analysis. (c) Diagram of MAGU-2::GFP transgene. (d) Images of PCR products using magu-2a and magu-2b specific primers after gel electrophoresis. Genomic DNA (gDNA) from N2 was used as a PCR reaction control. Messenger RNAs from N2 were reverse transcribed into cDNA. PCR of magu-2a is expected to produce a 5.7kb band from gDNA and 748bp band from cDNA; magu-2b is expected to produce a 323bp band from gDNA and a 270bp band from cDNA. (e) MAGU-2::GFP expression in an embryo, between 150 and 300 minutes after fertilization. Arrows indicate cluster of cells expressing MAGU-2::GFP. (f) MAGU-2::GFP expression in a z-plane through the lateral epidermis of an adult animal. (g-h) Representative fluorescence images of L1 larva expressing MAGU-2::GFP. Scale bars are 20 μm. (g) Maximum projection through superficial layers of lateral aspect of animal showing MAGU-2 expression in epidermis, but not in neuronal commissures. (h) Maximum projection through medial layers around nerve cord showing MAGU-2 expression in epidermal ridge, but not in neuronal cell bodies. Arrows indicate epidermal ridge.

