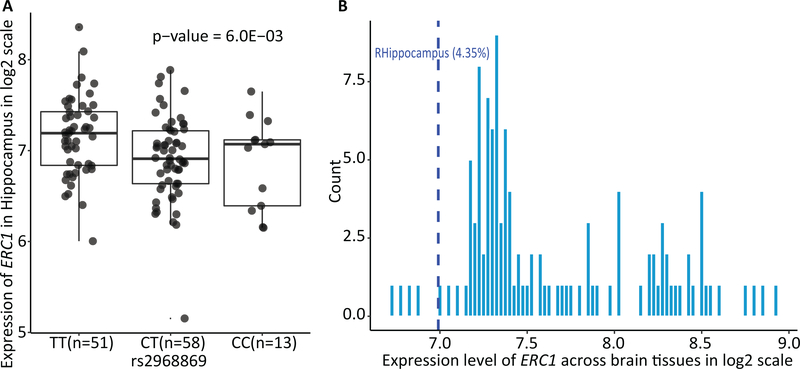
Figure 6. Hippocampus-specific expression of ERC1.
(A) illustrates the UKBEC hippocampus-specific cis-eQTL results. It shows the expression level of ERC1 in the hippocampus stratified by rs2968869 groups (TT, CT and CC). P-value indicates the association significance of rs2968869 with the expression level of ERC1 in the hippocampus. P-value is calculated from linear regression with gender as covariate. Presence of minor allele C of rs2968869 suggests the effect of decreased expression of ERC1. (B) illustrates the expression of ERC1 in the right hippocampus compared with other brain regions in AHBA. Histogram shows the distribution of ERC1 expression across 115 brain AAL ROIs. Blue line illustrates the expression level of ERC1 in the right hippocampus at the 4.35th percentile, indicating the ERC1 expression in the right hippocampus is higher than 4.35% brain regions.

