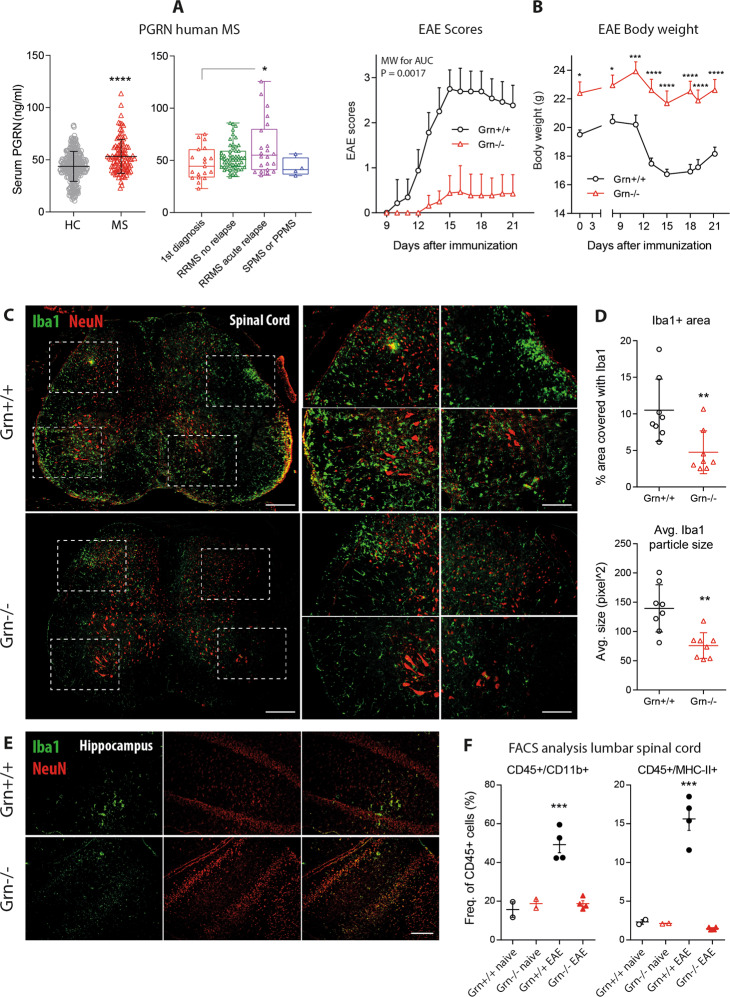
Fig. 1.
Serum progranulin concentrations in MS patients and disease course in EAE in progranulin-deficient mice. a Scatter plots (mean with SD) and a box-scatter plot of progranulin serum concentrations in 102 patients with multiple sclerosis and 301 healthy controls. The box shows the interquartile range, the line is the median, and the whiskers show the minimum and maximum. The data were analyzed by two-sided unpaired Student’s t-test for healthy vs. MS and one-way ANOVA followed by post hoc t-tests between each group using an adjustment of alpha according to Sidak for patient subgroups. The asterisks indicate significant differences between the groups; *P < 0.05, ****P < 0.0001. RRMS, relapsing-remitting MS; SPMS, secondary progressive MS; PPMS, primary progressive MS. b Time courses of the clinical EAE scores (mean ± 95% CI) and body weights (mean ± SEM) of Grn+/+ versus Grn−/− mice in MOG-induced primary progressive EAE. The AUCs of the scores were compared with the Mann–Whitney U test. The time courses of the body weights were analyzed using 2-way ANOVA and subsequent t-tests for each time point using an adjustment of alpha according to Sidak. The asterisks indicate significant differences between groups; n = 16 per group; *P < 0.05, ***P < 0.001, ****P < 0.0001. c Representative immunofluorescence images of the myeloid marker Iba1 in the lumbar spinal cord of Grn+/+ and Grn−/− mice 21 days after EAE induction. NeuN was used to counterstain the neurons. The right panel shows higher magnification images of the indicated regions. Scale bar = 200 µm for overviews and 50 µm for high-magnification images. d Scatter plots showing the quantification of the Iba1+ area and the average size of Iba1+ particles in the lumbar spinal cord of Grn+/+ and Grn−/− mice 21 days after EAE induction. The scatter shows the analysis of images of stitched SC sections at different sites (n = 3 mice per group with 2–3 images per mouse). Each full spinal cord section is made of 10–12 tiled images. The line is the mean, and the whisker shows the SD. The data were analyzed by unpaired two-sided Student’s t-test. The asterisks indicate significant differences between the groups; **P < 0.01. e Representative Iba1 immunofluorescence of the hippocampus of Grn+/+ and Grn−/− mice 21 days after EAE induction. NeuN was used to counterstain the neurons. n = 3 per group. Scale bar = 50 µm. f FACS analysis of the lumbar spinal cord from naive mice and EAE Grn+/+ and Grn−/− mice 21 days after EAE induction. Each dot represents one mouse. The scatter shows the number of CD45 + CD11b + myeloid cells, which represent microglia and macrophages, and of CD45 + MHC-II + leukocytes, which represent antigen-presenting cells (APCs). The data from the EAE mice were compared with two-tailed unpaired t-tests. The asterisks indicate significant differences between the groups; ***P < 0.001

