Fig. 4.
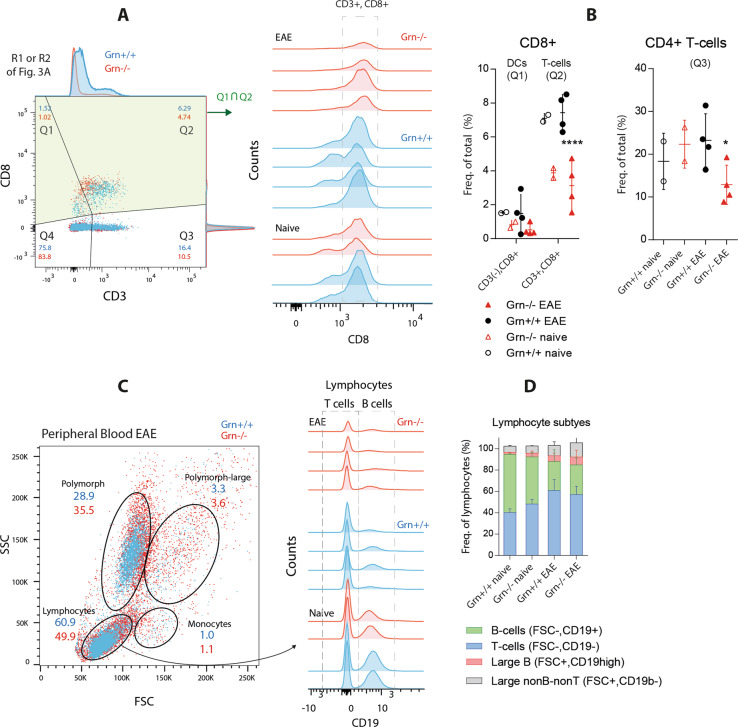
FACS analysis of T cell populations in EAE in progranulin-deficient mice. a FACS analysis showing representative scatter dot plots of splenic lymphocytes and mononuclear cells (R1 and R2 in Fig. 3a) in Grn+/+ and Grn−/− mice 21 days after the induction of EAE. Q1 and Q2 show CD8+ cells, which were further quantified in 4B. b Histogram of cells from gates Q1?Q2 in a from two naive mice and four EAE mice per group analyzed for CD8 expression. The indicated area of cells shows CD3+ CD8+ T cells, which are quantified in the left scatter plot, which also shows the number of CD8+ dendritic cells, and in the right scatter plot, which shown the number of CD8- T-cells. Q1, Q2, Q3 refer to the respective gates in a. The results of EAE mice were analyzed with 2-way ANOVA with population and genotype as the factors followed by post hoc analysis with adjustment of alpha according to Sidak. The asterisks show significant differences between the groups; *P < 0.05, ****P < 0.0001. c FSC versus SSC scatter plots of peripheral blood leukocytes showing the gating of leukocyte subpopulations in EAE Grn+/+ and Grn−/− mice 21 days after immunization. n = 4 per EAE group, n = 2 naive mice. Lymphocytes were further analyzed in 4D. d Histogram of the expression of the B-cell marker CD19. The indicated areas show CD19-T-cells and CD19+ B-cells. The stacked bar charts show the quantification of lymphocyte subpopulations based on size and CD19 expression. The subpopulations did not differ between genotypes

