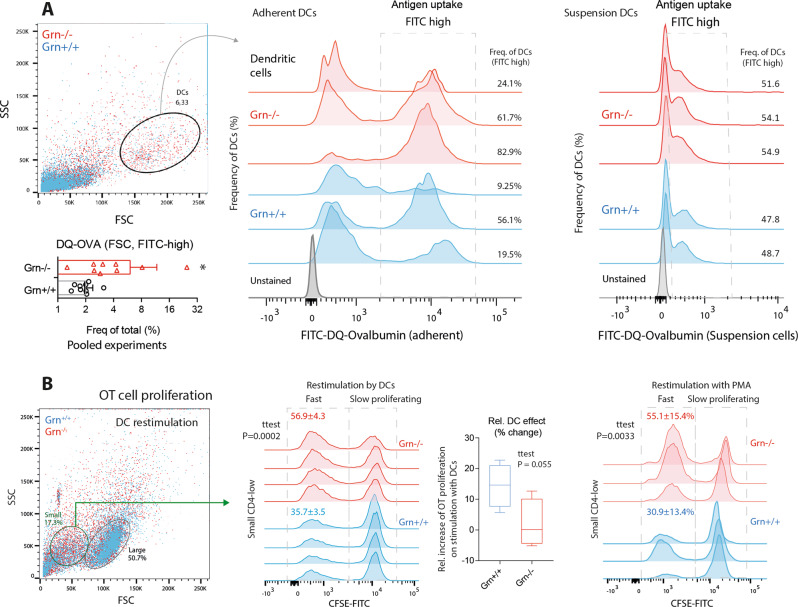
Fig. 5.
Antigen uptake by primary dendritic cells and proliferation of T-cells in contact with sensitized DCs. a FACS analyses of Grn+/+ and Grn−/− bone marrow-derived dendritic cells showing representative scatter dot plots and histograms of adherent (middle) and suspended (right) dendritic cells gated according to size (FSC) and granularity (SSC) and the uptake of ovalbumin-FITC. DC cultures were differentiated from myeloid bone marrow cells for 14 days and harvested 2 h after incubation with FITC-labeled DQ-ovalbumin (DQO). The framed areas in the histograms show FITC+ dendritic cells, which took up FITC-DQO. The scatter bar chart shows the quantification. Each dot represents one mouse. n = 8 Grn+/+; n = 9 Grn−/−. The data were analyzed by two-sided unpaired t-test. The asterisks show significant differences between the groups; *P < 0.05). b FACS analyses of OT cell proliferation upon coculture with ovalbumin-stimulated dendritic cells or stimulation with PMA. OT cells were harvested from the spleen 4 days after ovalbumin injection, labeled with CFSE, and exposed to DCs or restimulated with PMA or vehicle. CFSE dilution indicates a high rate of proliferation. Grn−/− OT cells show high proliferation (indicated by low CFSE) of small CD4low nonantigen specific T-cells. The numbers are the means ± SD. Each scatter represents a culture from one mouse. n = 4 per group

