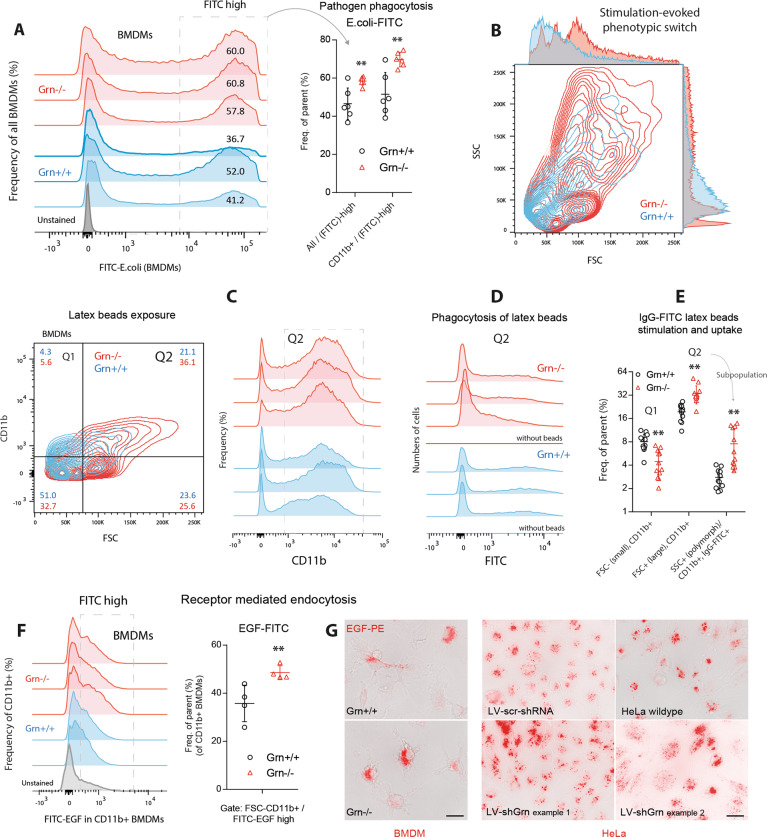
Fig. 6.
Phagocytosis and receptor-mediated endocytosis of primary bone marrow-derived macrophages. a FACS analysis of bone marrow-derived macrophages (BMDMs) of three Grn+/+ and three Grn−/− mice (two cultures per mouse) after stimulation with FITC-E. coli particles for 2 h. The framed area indicates FITC-positive BMDMs, which represent phagocytic cells. The scatter plots show the number of FITC+ cells. The data from each population were analyzed by two-sided unpaired t-test. The asterisks show significant differences between the groups; **P < 0.01. b Contour plots showing an example of the morphological transformation of BMDMs towards large polymorphic phagocytes upon exposure to IgG-FITC-labeled latex beads. Bone marrow stem cells were differentiated into BMDMs for 7 days and were treated with latex beads for 2 h. c Representative contour plots and histograms showing BMDMs gated according to size (FSC) and CD11b expression (quantification in e). d Histogram showing the number of FITC+ cells that phagocytosed FITC-IgG-labeled latex beads. e Number of CD11blow and CD11bhigh cells and FITC+ cells. Each scatter represents a culture from one mouse (n = 10 Grn+/+ mice and n = 11 Grn−/− mice). The data were analyzed by 2-way ANOVA with population and genotype as factors followed by post hoc analyses according to Sidak. The asterisks show significant differences between the groups; **P < 0.01). f FACS analysis of EGFR-dependent endocytosis. Histograms and scatter plots showing the number of CD11b + BMDMs in four Grn+/+ and Grn−/− mice after exposure to FITC-labeled EGF particles. The framed area indicates the FITC-high population, which is quantified in the scatter plot. Each scatter represents a BMDM culture from one mouse. BMDMs were exposed to EGF-FITC for 30 min. The data were analyzed by unpaired two-sided Student’s t-test. The asterisks show significant differences between thr groups; **P < 0.01. g EGF-PE immunofluorescence images of BMDMs from Grn+/+ and Grn−/− mice and of HeLa cells stably transduced with a lentiviral shRNA vector targeting progranulin15 (LV-shGrn) or scramble control vector (LV-scr-shRNA). The images show BMDMs and HeLa cells after 15 min of EGF-PE exposure. Scale bar = 10 µm

