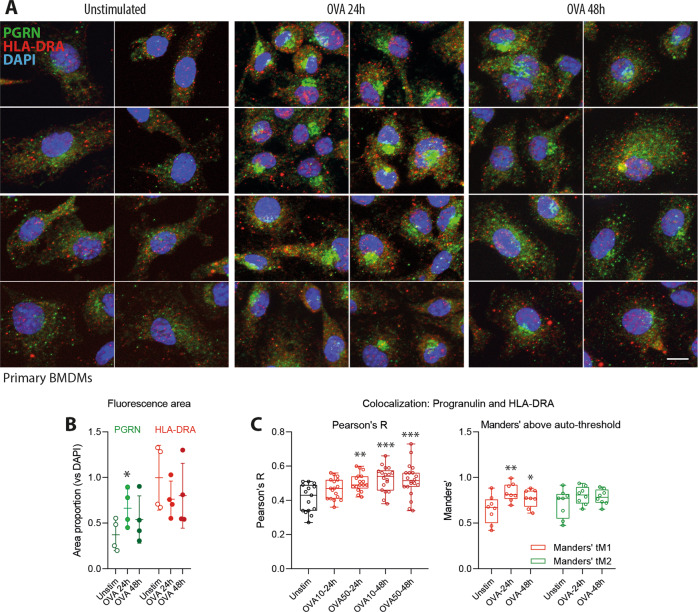
Fig. 7.
Progranulin endocytosis and colocalization with HLA-DRA in ovalbumin-stimulated primary BMDMs. a Representative images of progranulin (green) and HLA-DRA (red) immunofluorescence in primary bone marrow-derived macrophages (BMDMs) with and without stimulation with 10 µM ovalbumin for 24 or 48 h. DAPI was used as a nuclear counterstain (blue). Scale bar = 10 µm. b The expression level of HLA-DRA and progranulin upon stimulation with OVA was assessed by analyzing the area of immunofluorescence after the threshold was set according to Li’s algorithm in FIJI. The fluorescence areas were normalized to the DAPI area to account for the differences in the number of cells per image, and the areas were analyzed by two-way ANOVA followed by post hoc t-test with compared with unstimulated cells with a correction of alpha according to Dunnett. n = 4 cultures per condition. The line is the mean, and the whiskers show the SD. The asterisks show significant differences between the groups; *P < 0.05. c Quantitative 3D colocalization of progranulin and HLA-DRA immunofluorescence in apotome image stacks of six independent cultures per OVA dose and time point and analysis of up to four regions of interest (ROI) per stack. Each scatter shows the result of one ROI. The box shows the interquartile range, the line is the median and the whiskers show the minimum and maximum. Colocalization was assessed with FIJI using the Pearsons’ correlation coefficient and Manders’ tM1 and tM2 coefficients above the auto thresholds for channel 1 (HLA-DRA, red) and channel 2 (progranulin, red). The coefficients were analyzed by one-way ANOVA followed by post hoc t-test compared with unstimulated cells with a correction of alpha according to Dunnett. The asterisks show significant differences between the groups; *P < 0.05, **P < 0.01, ***P < 0.001

