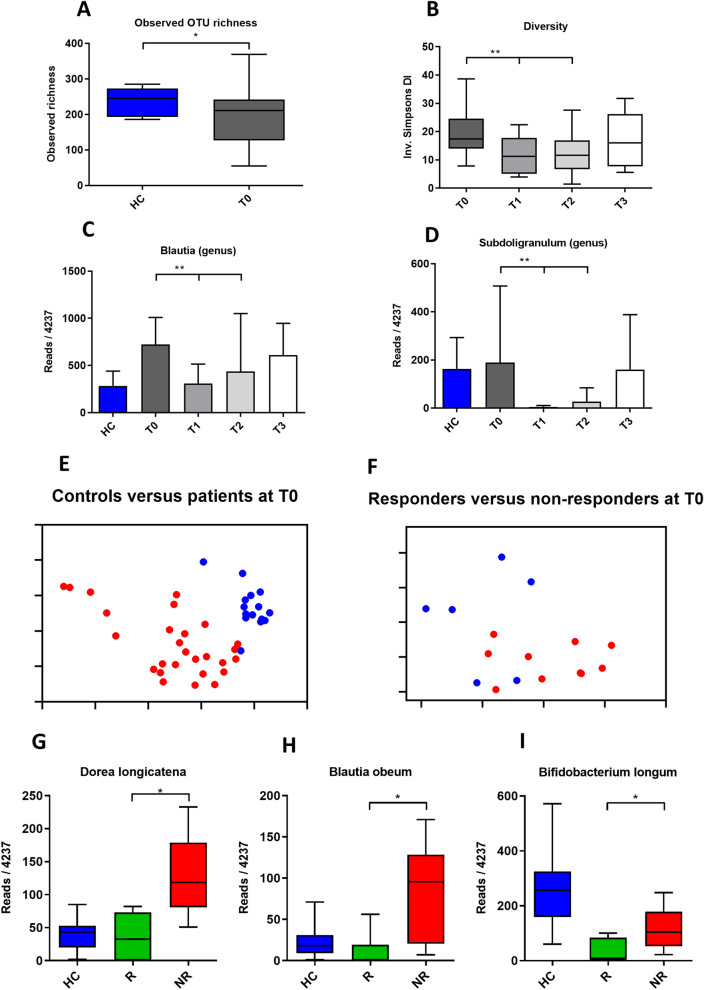
Figure 2.
Microbiota of patients versus controls, the effect of EEN and differences between responders and non-responders. Panel (A) shows the difference in richness between controls and patients at T0. Panel (B) shows that EEN reduced diversity. Panel (C) and (D) show the effect of EEN on the proportional abundance of the Blautia and Subdoligranulum genera. Principal coordinate (PCoA) plots in panels (E) and (F) show separation of controls (red) and patients (blue), and responders (red) and non-responders (blue) at T0. In panels (G,H) and (I) some of the species that comprise the signature of responders versus non-responders at T0 are depicted. HC healthy controls, R responders, NR non-responders.

