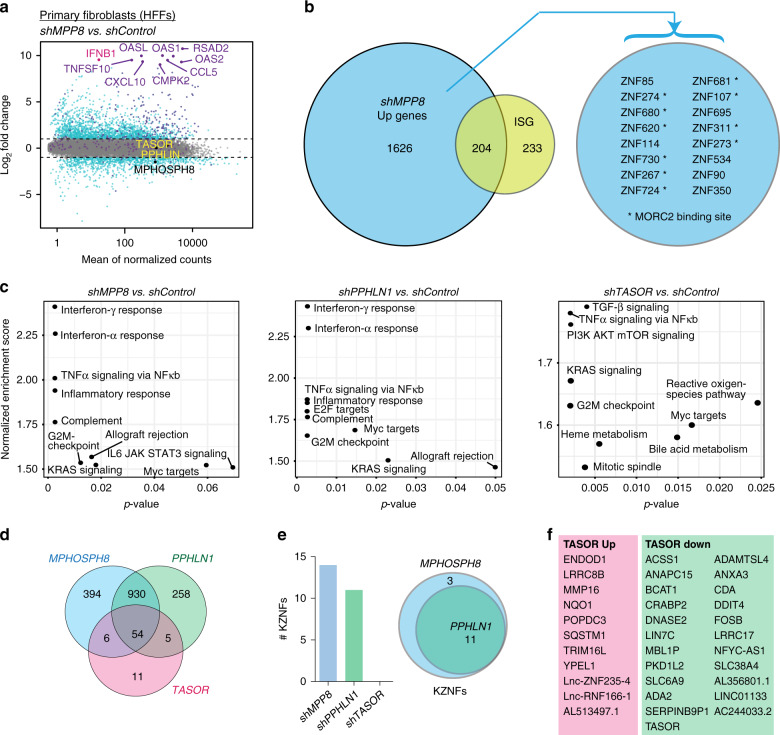
Fig. 2. The HUSH complex regulates genes involved in inflammation.
Primary fibroblasts (HFFs) were treated with shRNA vectors, and RNA harvested 6 days later for total RNA-sequencing. N = 6 biologically independent experiments. a MA plot showing results of differential expression analysis, where significantly differentially expressed genes (log2 fold change > 1 and a p-adjusted value < 0.05 after Benjamini–Hochberg multiple testing correction of Wald test p-value of shMPP8/shControl) have been highlighted in dark cyan and ISGs are shown in purple. See dataset 1 in Source data for all exact p values. Example upregulated ISGs are labeled as well as HUSH components (of which MPHOSPH8/MPP8 is downregulated). b Venn diagram showing overlap of ISGs (list defined in ref. 15) with genes upregulated in MPP8-depleted samples. Upregulated KZNFs are listed. See also Supplementary Fig. 2 for MORC2 binding data using public ChIP data33. c Total RNA-seq data were generated for samples depleted for each HUSH component vs. shControls (n = 3 biologically independent experiments and data are represented as gene set enrichment analyses using fgsea, where nominal p-values were calculated for 1000 permutations and corrected for multiple-testing using the Benjamini–Hochberg method). d Venn diagram showing overlap of genes upregulated in each HUSH-depletion. e Comparison of number and overlap of KZNFs upregulated in HUSH-depleted cells. f Significantly differentially-expressed genes unique to TASOR-depleted samples are listed.

