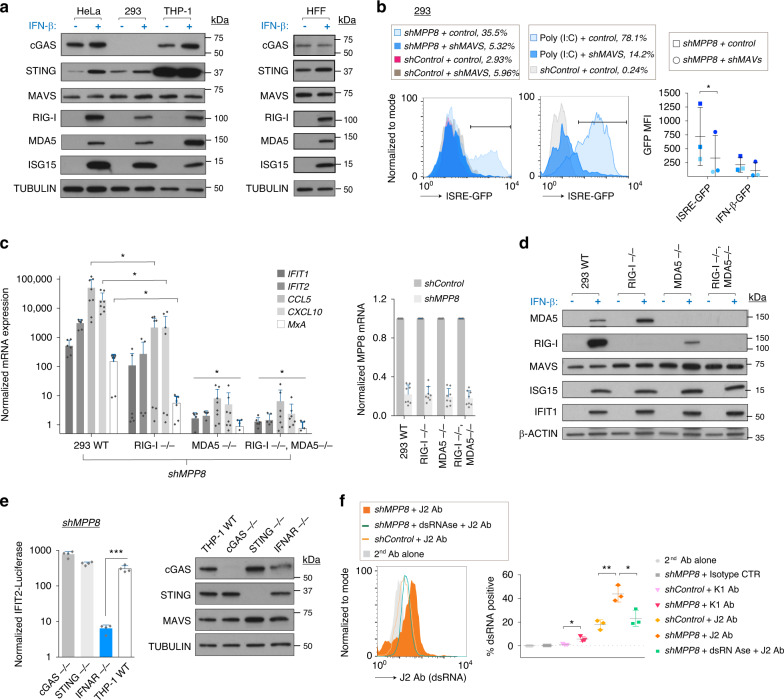
Fig. 3. MPP8-depletion is accompanied by RLR-dependent RNA sensing.
a Western blots on extracts from stated cells treated ± IFN-β for 24 h. N = 2 independent blots with one representative blot shown. b 293 cells were co-transduced with shControl or shMPP8 plus shMAVS or a control vector of the same backbone (hygromycin) and GFP was measured on day 6 (left). MAVS depletion was verified using polyI:C, added 24 h before FACS (middle). Summary data shown for experiments in ISRE-GFP and IFN-β-GFP reporter cells (right, n = 3 biologically independent samples). P = 0.0372 (one-tailed paired t test). MFI: mean fluorescent intensity. c Left: qRT-PCR expression of endogenous ISGs in the stated shRNA-treated 293 cell lines at day 6 (GAPDH normalized). N = 4 biological independent experiments with technical duplicates shown. CCL5 and CXCL10 were measured in all experiments while the other 3 ISGs were measured in 3 of the experiments. One-tailed paired t tests showed expression of all ISGs was significantly lower in MDA5−/− cells and double knockout (DKO) cells than in wildtype (WT) controls. IFIT1: p = 0.0063 (MDA5−/−), p = 0.0026 (DKO); IFIT2: 0.0007 (MDA5−/−), 0.0019 (DKO); CCL5: 0.0002 (MDA5−/−), 0.0028 (DKO); CXCL10: 0.0001 (MDA5−/−), 0.0007 (DKO); MxA: 0.0427 (MDA5−/−), 0.0423 (DKO). Expression of CCL5, CXCL10, and MxA was significantly decreased in RIG-I−/− cells compared to controls. CCL5: p = 0.0183; CXCL10: p = 0.0372; MxA: p = 0.0139. Right: MPP8 depletion efficiency summary (n = 4 biologically independent experiments with technical duplicates shown. d Western blots on extracts from cell lines from c treated ± IFN-β for 24 h. N = 2 independent blots with one representative blot shown. e Left: stated knockout or control (WT) THP-1 reporter cell lines were treated with shRNAs and assayed for secreted Lucia luciferase (driven by IFIT-2) 6 days later. N = 4 biologically independent experiments. Luciferase readings were normalized to background values in shControl-treated cells. P = 0.0003 (one-tailed paired t test). Right: western blots on extracts from stated cells. N = 3 independent blots with one representative blot shown. f 293 cells were treated with shRNAs and fixed 6 days later for intracellular staining with dsRNA antibodies, J2/K1 or control antibodies. N = 3 biologically independent samples. Two-tailed unpaired t test p values = 0.0166 (shMPP8 vs. shControl for K1 Ab); 0.0048 (shMPP8 vs. shControl for J2 Ab); 0.0212 (shMPP8 + J2 Ab ± dsRNase). All data presented in this figure show mean values ± SD.

