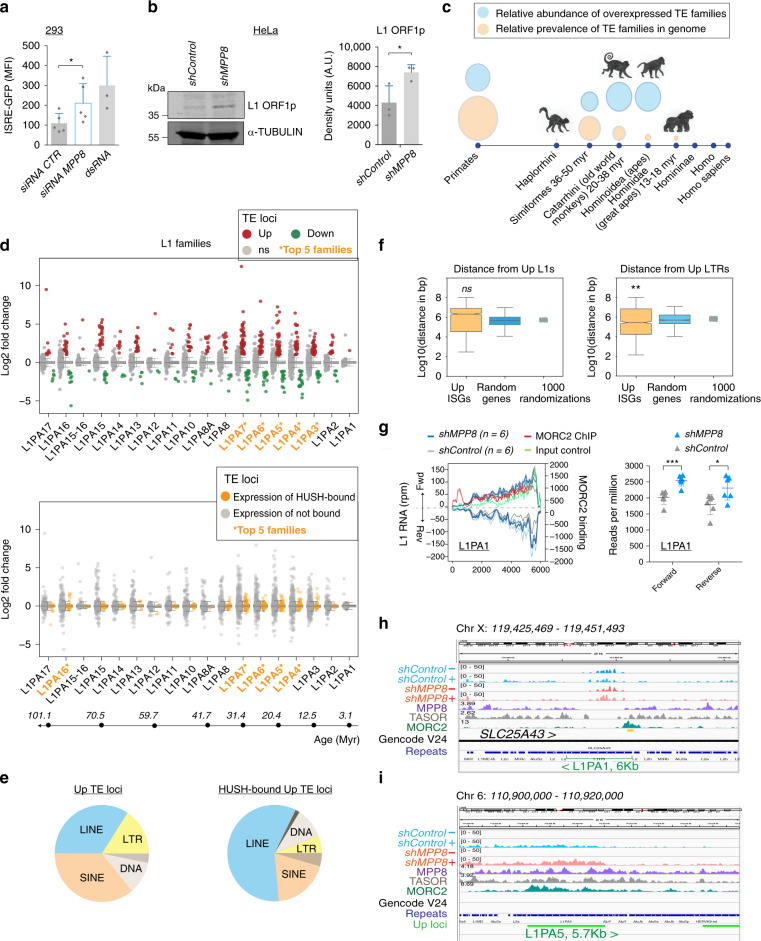
Fig. 4. MPP8-depletion results in overexpression of LINE-1s and LTRs.
a ISRE-GFP reporter 293 cells were transfected with control (CTR) or MPP8 siRNAs or dsRNA as a positive control and GFP measured on day 6. N = 5 biologically independent samples or N = 3 for the positive control. P = 0.0108 (two-tailed paired t test). Data show mean ± SD. MFI: mean fluorescent intensity. b Left: HeLa cells were harvested 4 days post shRNAs and used for western blot for L1 ORF1 protein and alpha-Tubulin. Right: western quantification. N = 3 biologically independent samples. P = 0.0426 (one-tailed paired t test). Data show mean ± SD. c Bubble plots showing the relative prevalence of all TEs in the genome by clade (orange) and relative abundance of overexpressed TE families in shMPP8 samples compared to controls (blue) using RNA-seq data from Fig. 2 and the software TEtranscripts. See Supplementary Fig. 4a for complete diagram. Monkey images drawn by lab members. d Upper panel: TE loci up or downregulated in MPP8-depleted cells (log2 fold change >1, and p adjusted values <0.05 after Benjamini–Hochberg multiple testing correction of Wald test p-value of shMPP8/shControl from DESeq2). See dataset 3 in Source data for all exact p values. Results are shown for loci within the stated LINE-1 families. Ns = expression not significantly changed. Lower panel: strip plot showing HUSH-bound (orange) vs. not known to be bound (gray) LINE-1 loci with their relative expression in shMPP8 samples compared to controls. HUSH peaks defined using epic2, see Supplementary Fig. 3a, using data from ref. 33. The approximate ages of these LINE-1 families are given underneath using79. See Supplementary Fig. 4b for LTR data. The subfamily names with the highest number of upregulated loci (top) or bound loci (bottom) are highlighted in orange. Boxes represent 1st and 3rd quartile, where the central line corresponds to the median; whiskers are ×1.5 of the interquartile range. e Pie charts showing upregulated TE loci (left) and HUSH-bound TE loci (right) classified by family. f Median distance of Upregulated L1s (n = 1494) or LTRs (n = 1177) to transcription start sites of upregulated ISGs (n = 204) compared to the same number of random genes or to the median distance across 1000 randomizations. The median distance for LTRs is significantly closer than randomized genes (p = 0.001, where a one-sided p value was calculated as (1+ no. of randomizations with a median greater than the observed value)/1000 randomizations). Boxplots as in (d) where notches indicate the confidence interval. g Left: the L1PA1 consensus sequence (repBase) was mapped with RNA-seq reads in both strands (left y axis) or with MORC2 ChIP and total input reads from public data33 (right y axis). Right: The number of RNA-seq reads mapping forward or reverse strands of the L1PA1 consensus sequence were plotted for all samples. Two-tailed unpaired t test values: p = 0.0006 (forward) and p = 0.0291 (reverse). Data show mean ± SD. h Bigwig visualization of example HUSH-bound young LINE-1 expressed bidirectionally and a HUSH-sensitive primate-conserved LINE-1 expressed in sense (i). RNA-seq track scales were all set at 50 and normalized tracks of HUSH-binding were made using data from ref. 33.

