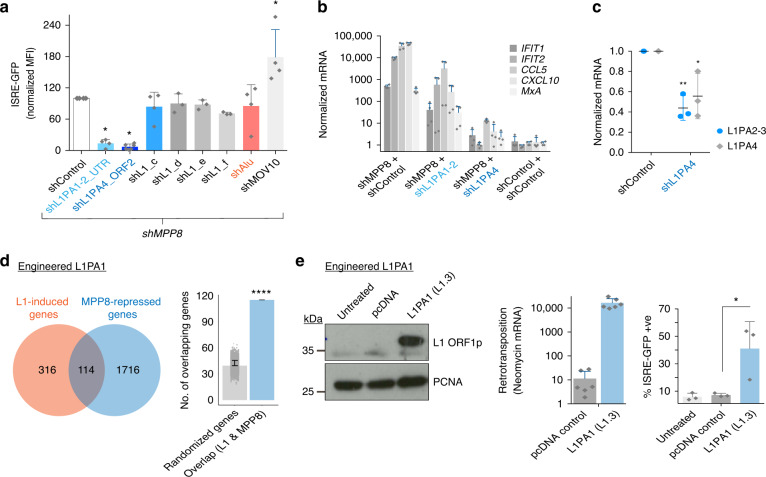
Fig. 5. LINE-1s regulate the type I IFN response.
a 293 reporter cells were shControl/shMPP8 treated together with the stated shRNAs against TE families or shControl again. GFP MFI (mean fluorescence intensity) at day 6 was normalized to the shMPP8 + shControl sample that was set at 100%. N = 4 biologically independent samples, except for shL1_d-f, where n = 3 and shL1PA4, where n = 6. The control was significantly different to the shL1PA1 group (p = 0.0172), the shL1PA4 group (0.0110) and the MOV10 group (p = 0.0265) (two-tailed paired t tests). b Groups were setup as in (a) but here endogenous ISG expression was measured by qRT-PCR. N = 2 biologically independent experiments with technical duplicates shown. c Knockdown efficiency was verified by qRT-PCR using global LINE-1 primers. N = 3 biologically independent experiments. A decrease in global LINE-1 expression was detectable for shL1PA4: p = 0.0013 (L1PA2-3) and p = 0.0268 (L1PA4) (two-tailed unpaired t tests). d Venn diagram showing overlap of genes induced by overexpression of an engineered L1PA1 reporter in RPE cells from ref. 21 (a Tet-inducible codon-optimised L1PA1 vs. Luciferase control that was induced for 3 days) and genes upregulated upon MPP8-depletion here. Of 114 genes that overlap, 49 are ISGs. Right: significance was assessed by selecting 10,000 randomizations of the same number (1830) of random genes and looking at the mean number that are shared with the L1-induced genes. P = 5.1203e−24 (hypergeometric test). e 293 reporter cells transfected with a pcDNA control or engineered L1PA1 reporter plasmid (ksCMV-101: L1PA1 subtype L1.3). Transfection and retrotransposition verified by western blot and qRT-PCR for spliced Neomycin expression at day 4 (left and middle). N = 3 biologically independent experiments with technical duplicates shown. Right: IFN reporter induction was measured by GFP FACS. N = 3 biologically independent experiments. P = 0.0332 (one-tailed paired t test). All data presented in this figure show mean values ± SD.

