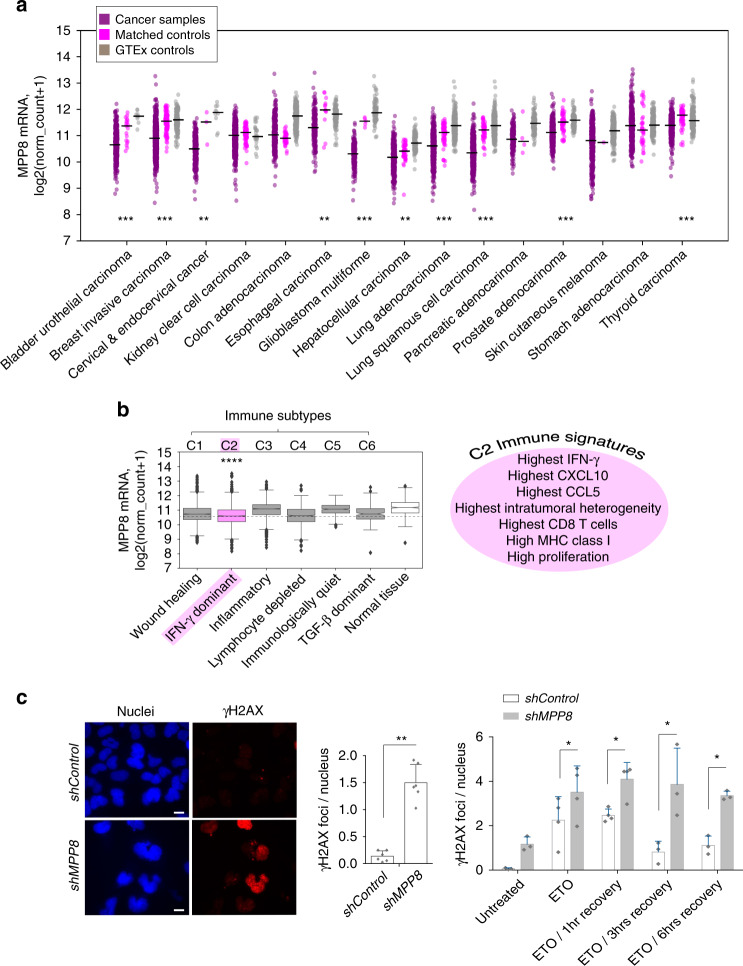
Fig. 6. MPP8 is frequently downregulated in cancers.
a Using The Cancer Genome Atlas (TCGA) data, we selected cancers for which there were matched control samples as well as GTEx expression data from the same tissue. MPP8 is scored here as significantly downregulated when levels are lower in the cancer compared to both controls separately, using a two-sided Mann–Whitney rank test and correcting for multiple testing (p adjusted values were all <0.05 for groups marked with asterisks). Adjusted p values for matched control comparisons and GTEx comparisons respectively are given here: bladder urothelial = 2.40e−05, 1.58e−06; breast invasive = 5.40e−35, 8.79e−61; cervical & endocervica l= 3.12e−03, 2.37e−07; esophageal = 1.07e−03, 4.0e−15; glioblastoma = 2.10e−08, 6.61e−40; liver hepatocellular = 1.31e−03, 5.57e−31; lung adeno = 1.19e−11, 9.56e−82; lung squamous cell = 2.40e−26, 1.41e−97; prostate adeno = 2.06e−11, 8.27e−31; thyroid = 1.25e−10, 9.24e−17. b Left: all cancers were divided by immune subtype based on ref. 17 and levels of MPP8 expression were plotted. MPP8 levels were most significantly different in subtype C2 compared to normal tissue (after pairwise, two-sided t tests between each immune subtype and normal tissue with an fdr multiple test correction: padj = 8.03e−94; C1 n = 2,066, C2 n = 2413, C3 n = 2334, C4 n = 1129, C5 n = 378, C6 n = 180 samples). Boxes represent 1st and 3rd quartile and the central line is the median. Notches indicate the confidence interval; whiskers correspond to 1.5 of the interquartile range and outliers are depicted as diamonds. Right: features of cancers within immune subtype C2 are displayed (terms from ref. 17). c 293 reporter cells were treated with shRNAs and then either untreated or treated with etoposide (ETO) for 30 min and allowed to recover for stated times before γH2AX staining. Left: example γH2AX staining images. Middle: summary data of γH2AX foci: N = 6 biologically independent samples. p = 0.0013 (two-tailed paired t test). Right: summary data of recovery assay. N = 4 biologically independent samples, except for the groups, ETO and ETO/1 h, where N = 3. Two-tailed paired t test p values = 0.0303 (ETO) 0.0486 (ETO/1 h) 0.0384 (ETO/3 h) and 0.0258 (ETO/6 h). Data show the mean ± SD. See Supplementary Fig. 6e for HeLa data.

