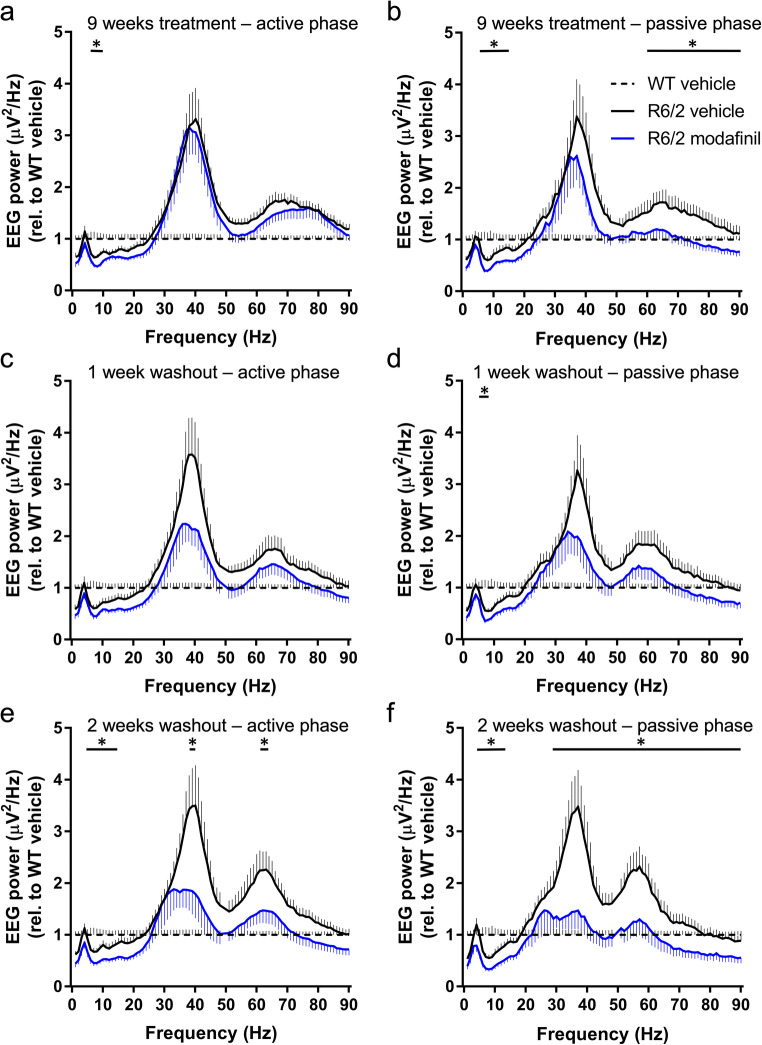
Fig. 6.
The effect of chronic modafinil treatment on the quantitative electroencephalography (EEG) in R6/2 mice measured during wakefulness. EEG spectra of vehicle- (solid black line) or modafinil (solid blue line)-treated groups during the first 2 h of the active (a, c, and e) and the passive phase (b, d, and f), after 9 weeks of treatment (a and b) and following 1 week (c and d) or 2 weeks of washout (e and f). Data are presented as mean ± SEM in 1 Hz bins, normalized to the WT vehicle group (dashed line). Changes in the qEEG spectra following chronic modafinil treatment were quantified across the spectrum in standard frequency ranges (δ [1–4Hz], θ [5–9Hz], α [10–14 Hz], β [15–30 Hz], γ1 [31–60 Hz], and γ2 [61–90 Hz]). Statistically significant differences (two-way ANOVA and Bonferroni post hoc comparisons, *p < 0.05) are shown by black bars (modafinil vs. vehicle treatments) above the graphs

