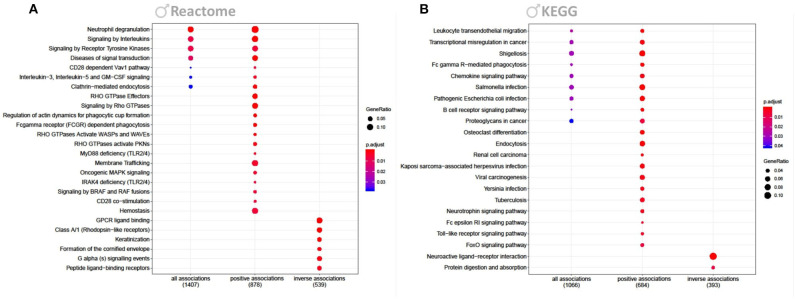
Figure 3.
Reactome and KEGG overrepresentation analysis. Figure shows enriched Reactome (A) and KEGG (B) pathways for genes significantly associated to Cd in males (FDR <0.2). Each figure shows enriched pathways for all, only positive and only inversely associated transcripts. P-values of the enrichment analysis have been corrected by FDR and are indicated by color. Bullet sizes represent the gene ratio of transcripts from the associated genes. Numbers in brackets are transcripts that were mapped to the listed pathways.

