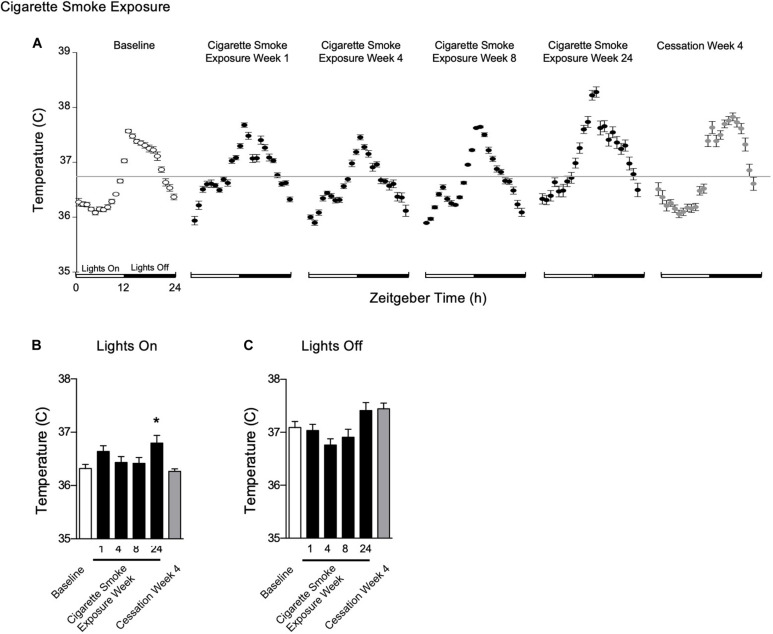
FIGURE 4.
Physiological responses of body temperature at baseline, weekend 1, 4, 8, and 24 of cigarette smoke exposure, and cessation week 4. (A) Hourly averages for cigarette smoke exposure and cessation experiments. Horizontal gray bars represent the mesor at baseline (36.7°C). Average body temperature during (B) lights on and (C) lights off. Dunnett’s post hoc test was performed on normally distributed data sets. For non-normally distributed data, Kruskal–Wallis’ test was used with Dunn’s post hoc test. *P < 0.05 compared to baseline was considered statistically significant. All values are mean ± SEM (n = 9 at baseline, n = 4 at week 1, n = 4 at week 4, n = 5 at week 8, n = 5 at week 24, and n = 4 at cessation week 4).

