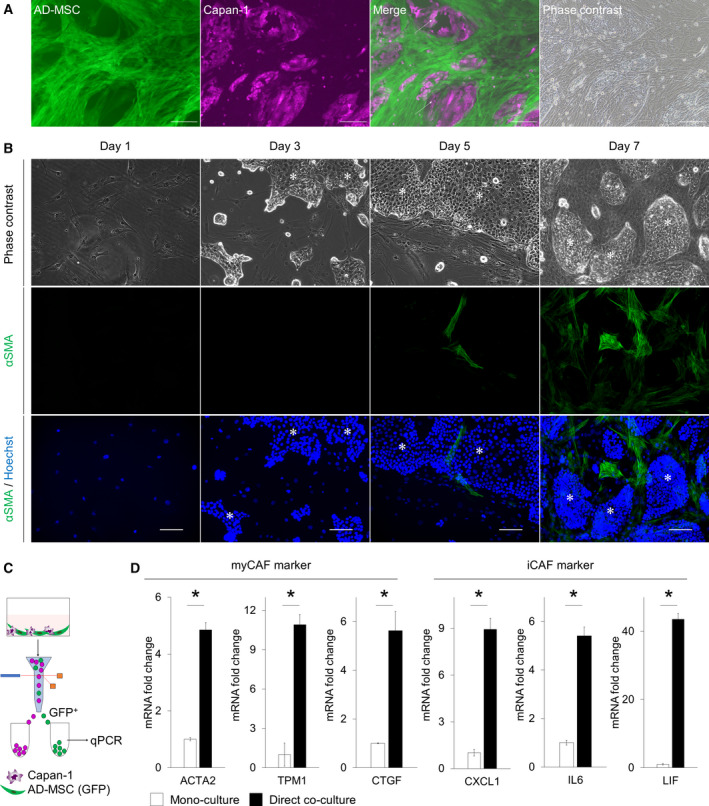
Fig. 2.

Co‐culturing AD‐MSCs directly with Capan‐1 induced differentiation into myCAF‐like cells. (A) Representative image of a direct co‐culture. Arrows indicate AD‐MSCs overlapped on Capan‐1s. Scale bar: 200 µm. (B) Representative IF image of AD‐MSCs directly co‐cultured with Capan‐1 stained for αSMA (green) on days 1, 3, 5, and 7. Counterstain: Hoechst 33342 (blue). Asterisks indicate Capan‐1 aggregations. Scale bar: 100 µm. (C) Schematic illustration of the direct co‐culture and flow‐cytometric sorting platform. (D) qPCR analysis of the myCAF marker or iCAF marker in monoculture or direct co‐culture. Results are presented as the mean ± SD of three biological replicates. *P < 0.05, unpaired Student’s t‐test.
