
FIGURE 3.
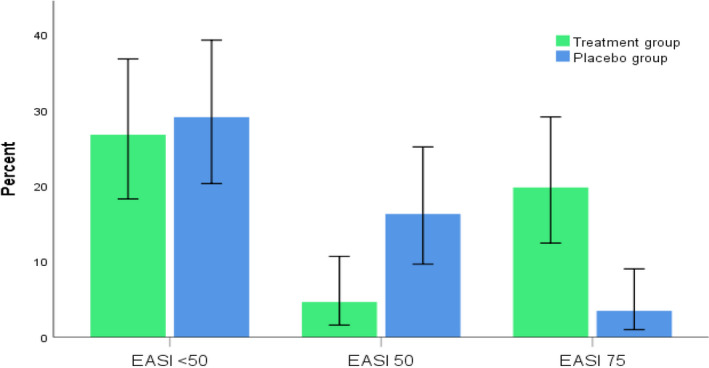
Percentage of patients who achieved <50% improvement in EASI score (non‐responders), achieved ≥50% to <75% improvement (EASI 50), achieved ≥75% improvement (EASI 75) at the end of the study in both groups. Error bars: 95% CI, (P < .05)
Official websites use .gov
A
.gov website belongs to an official
government organization in the United States.
Secure .gov websites use HTTPS
A lock (
) or https:// means you've safely
connected to the .gov website. Share sensitive
information only on official, secure websites.
Percentage of patients who achieved <50% improvement in EASI score (non‐responders), achieved ≥50% to <75% improvement (EASI 50), achieved ≥75% improvement (EASI 75) at the end of the study in both groups. Error bars: 95% CI, (P < .05)