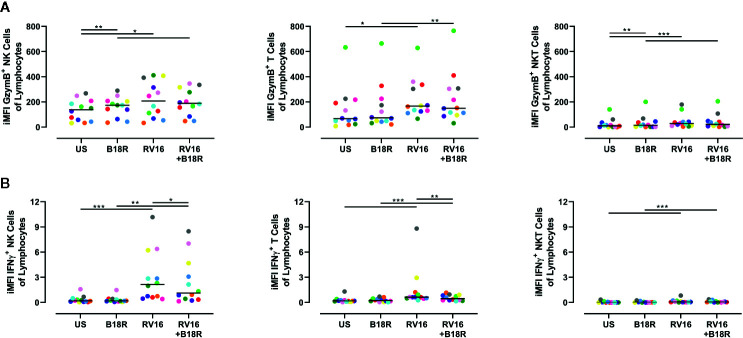
Figure 7.
NK cells are responsible for producing a large amount of the GzymB and IFNγ seen in RV16-stimulated PBMCs. PBMCs from healthy people (n=12) were cultured in vitro with B18R (100 ng/ml) for 1 h, prior to stimulation with RV16 (MOI = 1), alongside an unstimulated control (US) for 24 h. Expression of cell surface markers and intracellular cytokine production was determined by flow cytometry. (A) iMFI GzymB-producing NK cells, T cells, and NKT cells, scaled to account for their population size. (B) iMFI IFNγ-producing NK cells, T cells, and NKT cells, scaled to account for their population size. Each colored symbol represents data from one donor, lines represent medians. Data are representative of three experiments. *p<0.05, **p<0.01, ***p<0.001 by Wilcoxon matched-pairs signed rank tests. NK, natural killer; GzymB, granzyme B; IFNγ, interferon gamma; RV16, rhinovirus 16; PBMC, peripheral blood mononuclear cell; IFN-I, type I interferon; UT, untreated; MOI, multiplicity of infection; US, unstimulated; iMFI, integrated median fluorescence intensity; NKT, natural killer T.

