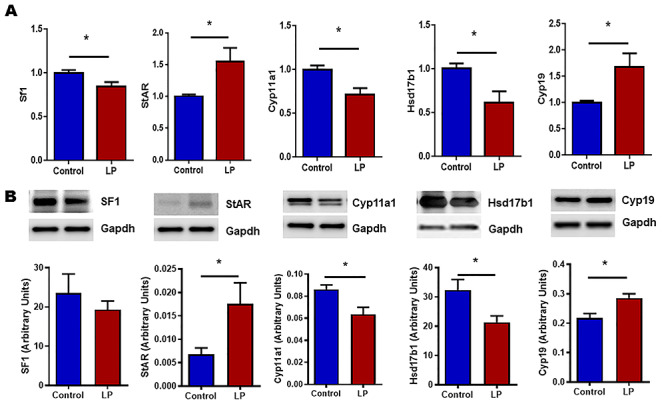
Figure 2.

mRNA and protein expression levels of molecules involved in steroidogenesis measured by qPCR and western blot, respectively, in testis. (A) Figure showing the mRNA expression of steroidogenic factor 1 (Sf-1), Star, Cyp11a1, Hsd17b1, and Cyp19 (Aromatase). qPCR data were normalized with cyclophilin A as an internal control. (B) Representative blots and their densitometric analyses showing the protein levels of Sf-1, StAR, Cyp11a1, Hsd17b1 and Cyp19. GAPDH was used as a loading control for western blots, and its values were used for normalization. Results are presented as mean ± SEM, n = 4–6 per group (*P < 0.05).
