
Figure 3.
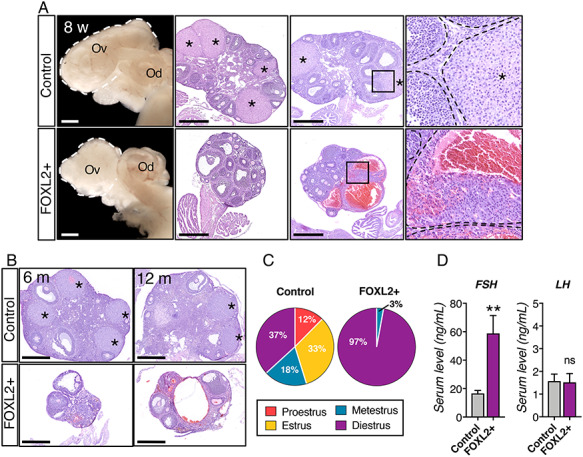
Absence of corpora lutea and regular estrous cycle in FOXL2+ females. (A) Bright field images and H&E stained sections of control and FOXL2+ ovaries at 8 weeks of age. White dotted lines outline the ovaries. Black dotted lines outline follicles and corpora lutea. Ov: ovary; Od: oviduct; *: corpus luteum; Scale bar: 500 μm; n = 4/genotype. (B) H&E stained sections of control and FOXL2+ ovaries at 6 and 12 months old. *: corpus luteum; Scale bar: 500 μm; n = 4/genotype. (C) Pie charts represent the mean percentage of days the mice spent in each stage of the estrous cycle (n = 5 mice/genotype). (D) Serum levels for FSH and LH in control and FOXL2+ mice at 8 weeks of age. The results were analyzed with Mann–Whitney test; mean ± SEM (n = 6/genotype); **P < 0.01, ns: non-significant.