
Figure 6.
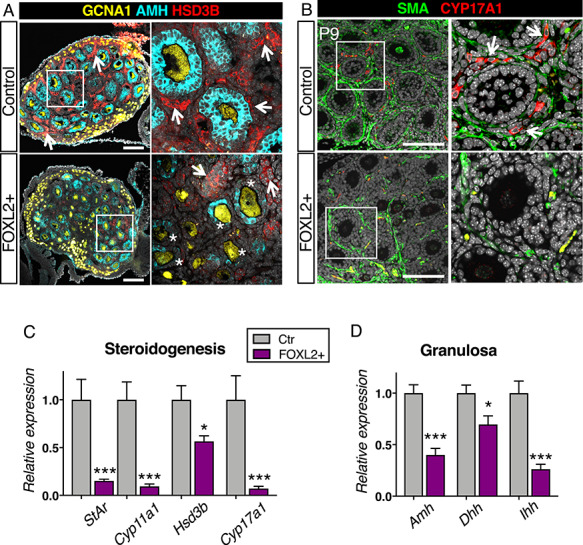
Overexpression of FOXL2 impairs theca cell differentiation. (A) Immunofluorescence for the steroidogenic enzyme HSD3B (red), granulosa cell marker AMH (cyan) and germ cell marker GCNA1 (yellow) in control and FOXL2+ ovaries at postnatal day 9 (P9). Right panels are higher magnification of outlined areas. Arrows indicate HSD3B+ theca/interstitial cells. *: AMH-negative granulosa cells. Scale bar: 100 μm; n = 4/genotype. (B) Immunofluorescence for the steroidogenic enzyme CYP17A1 (red) and SMA (green) in control and FOXL2+ ovaries at P9. Right panels are higher magnification of outlined areas. Arrows indicate CYP17A1+ theca cells. Scale bar: 100 μm; n = 4/genotype. The yellow staining represents autofluorescent blood cells. (C-D) qPCR analysis of expression of steroidogenic enzymes Hsd3b, Cyp17a1, Cyp11a1 and Star (C) and granulosa cell genes Amh, Dhh and Ihh (D) in control and FOXL2+ ovaries at P9. The data were analyzed with a Student t-test; Bar graphs represent mean ± SEM (n = 7–8/genotype); ***P < 0.001; *P < 0.05.